 テリエ法の実験結果の解析: pinte
プログラム "pinte" はテリエ法(Thellier and Thellier, 1959)による古地磁気強度(古地球磁場強度)の実験結果を解析します.プログラムはテリエ法の異なる実験手順, ZI (Coe et al., 1978), IZ (Aitken et al., 1988), IZZI (Tauxe & Staudigel, 2004) による3種類のデータ・フォーマートを解析できます.データ・フォーマートは1つのファイル内で統一し,ファイル冒頭で指定する必要があります.各ステップで測定された帯磁率を個々のデータ行に含めることができますが, \(\chi-T\) 曲線のプロットにはプログラムを "pinte -C input_file" のように起動する必要があります.アライ・プロット(Arai plot, Nagata et al. 1963)上での直線部分の決定には,コマンド L による直線近似を使用し,ステップ範囲の選択は手動で行います.テリエ法の実験結果の信頼性に対する論争が続いていることを考慮して,プログラムは種々のパラメータを計算し出力します.通常の良質係数(quality factors, Coe et al. 1978)とともに,これらのパラメータは実験結果の信頼度を判断するのに役立ちます.見積もられたパラメータは,プロット図が新しくなるたびに, "sample_name.PI" という名のファイルに自動的に出力されます.下図はアイスランドの玄武岩試料から得られたアライ・プロットの例です(Tanaka and Yamamoto, 2016).この実験では, MD テール・チェックは省略されましたが,プログラムにはそれを解析する機能はあります.
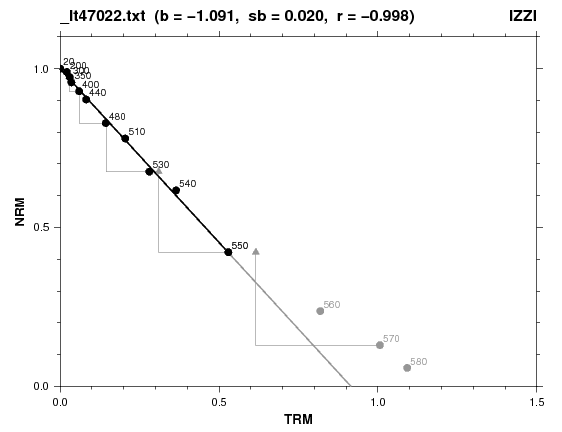
古地磁気強度の結果を評価するパラメータの1つに,直線部分を円で近似したときの曲率があります(Paterson, 2011).プログラムは円近似において, Chernov (2012) による Taubin (1991) 法の C++ コードを C コードに変換した関数を使用しています.下図はコマンド C による円近似の例で,上図と同じデータで全温度範囲に適用しました.
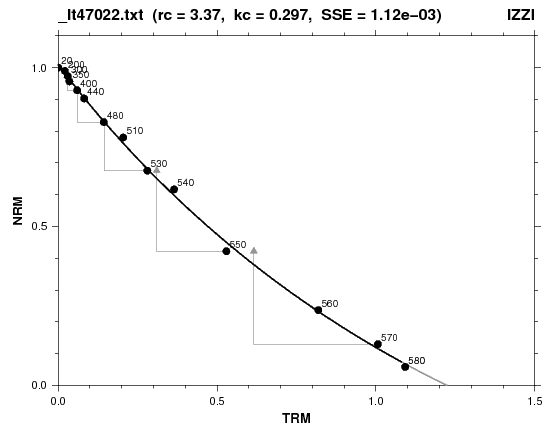
上図のアライ・プロットでは,近似された円がかなり大きな曲率,即ち小さな半径(\(r_c\)=3.4),であることは明らかです.しかし,アライ・プロットが大きな曲率を持つという理由だけで,これらのデータを棄却することは避けるべきです.筆者は,湾曲したアライ・プロットの原因は多くの場合,試料の物理的または化学的変質であり,純粋に多磁区粒子や擬似単磁区粒子の効果ではないと考えています.実際,直線部分の範囲を,上の1番目の図における直線近似と同じ 20°C から 550°C に取ると,フィットされた円の曲率はずっと小さくなります(\(r_c\)=12.9).仮に,低温部分が粘性残留磁化(viscous remanent magnetization, VRM)の影響を受けていると考えて温度範囲を 350°C-550°C に限定すれば,データ点は実質的に直線となります(\(r_c\)=330).
プログラムのダウンロード
参考文献:
- Aitken, M.J., A.L. Allsop, G.D. Bussell, and M.B. Winter, Determination of the intensity of the earth's magnetic field during archaeological times: reliability of the Thellier technique, Rev. Geophys., 26, 3-12, 1988.
- Chernov, N, Fitting ellipses, circles, and lines by least squares, 2012. (→ http://people.cas.uab.edu/~mosya/cl/index.html)
- Coe, R. S., S. Gromme, and E. A. Mankinen, Geomagnetic paleointensities from radiocarbon-dated lava flows on Hawaii and the question of the Pacific nondipole low,J. Geophys. Res., 83, 1740-1756, 1978.
- Nagata, T., Y. Arai, and K. Momose, Secular variation of the geomagnetic total force during the last 5000 years, J. Geophys. Res., 68, 5277-5281, 1963.
- Paterson, G.A., A simple test for the presence of multidomain behavior during paleointensity experiments, J. Geophys. Res., 116, B10104/10.1029/2011JB008369, 2011.
- Tanaka, H., and Y. Yamamoto, Palaeointensities from Pliocene lava sequences in Iceland: emphasis on the problem of Arai plot with two linear segments, Geophys. J. Int., 205, 694-714, 2016. (→ doi:10.1093/gji/ggw031)
- Taubin, G., Estimation of planar curves, surfaces and nonplanar space curves defined by implicit equations, with applications to edge and range image segmentation, IEEE Trans. Pattern Analysis Machine Intelligence, 13, 1115-1138, 1991.
- Tauxe, L., and H. Staudigel, Strength of the geomagnetic field in the Cretaceous Normal Superchron: New data from submarine basaltic glass of the Troodos Ophiolite, Geochem. Geophys. Geosystems, 5, GC000635, 2004.
- Thellier, E., and O. Thellier, Sur lintensite du champ magnetique terrestre dans le passe historique et geologique, Ann. Geophys., 15, 285-376, 1959.