|
|
Apocalypse on Global Heating |
Abstract
Up to Industrial Revolution, we had used renewable energy such as wood for our daily use. Start of fossil fuel utilization bought us comfortable life style, rapid growth of our population and global heating. But we have used almost half of recoverable oil reserves and about one third of natural gas. Regardless of global heating, it is evident that we have to come back to renewable energy again in the next century. Conservation and improvement of efficiency can only prolong to reach such status. Therefore, we have to develop new technology such as low cost solar cell and or artificial photosynthesis until such time. Nuclear, bio, hydraulics, wind might not be sufficient enough to fill our need until we develop, low cost solar cells. Therefore, we have to fill our need by coal utilization. Again new technology will be needed to avoid global heating by sequestration of carbon dioxide in ocean. One possibility is to convert carbon dioxide to calcium bicarbonate by neutralization using lime stone.
Introduction
After retirement from a life of designing and constructing natural gas liquefaction and receiving terminal, I have been enjoying bike touring, sailing, walking skiing, and mountain climbing as wall as updating web site named Seven Mile Beach File under the name of Greenwood. In this article, though, I would like to discuss about how we can survive coming age not spoiling our planet. I named it "Apocalypse" because my view is not accepted as a common understanding.
Birth of Life and Accumulation of Oxygen and Fossil Fuel
It is said that birth of life is the main cause of accumulation of oxygen and fossil fuel. Carbon dioxide originally existed in the atmosphere were consumed by living creature as a carbon source and oxygen was disposed to atmosphere. There remain formed fossil fuel.
Agriculture and Explosion of Population
Homo sapiens invented agriculture. The increased resources enabled them to increase their population up to the availability limit.
Fossil Fuel and Industrial Revolution
Up to Industrial Revolution, we had used renewable energy such as wood for our daily use. Start of fossil fuel utilization bought us comfortable life style, rapid growth of our population. James Watt freed us from hard labor and Fritz Haber and Carl Bosch assured us more food and more population. Gladys Bingham's finding at Spindle Top near Beaumont brought us internal combustion engine and consequential high speed driving over highways and flying in the air. But we are paying the cost. It is global heating.
Peak Oil
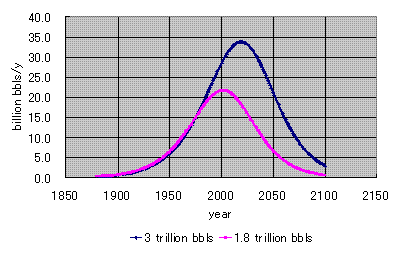
In 1998, Colin Cambell of ex-BP geologist estimated that ultimate recoverable oil reserves is 1.8 trillion bbls. Later US geological society estimated it is almost 3 trillion bbls.

Fig.-1 Peak Oil
I have made production profiles for both estimate of ultimate recoverable reserves using logistic model as presented in Fig.-1. Logistic model is expressed as
Nt+1=Nt + r0 Nt (1-Nt/K)
Where Nt is production in t-th year and r0 is rate of increase and K is ultimate recoverable reserves. If we take Colin Cambell's estimate of 1.8 trillion bbls for K. It seems that we have spent half of the reserves already. Because of this reason, crude oil price reached 100 $ /bbls in early 2008.
According to BP statistics, coal and natural gas have bigger reserves. But still in the next century, we will face depletion of fossil fuel.
| Fossil Fuel | remaining recoverable reserves | R/P ratio (year) |
| Coal | 1 trillion ton | 164 |
| Oil | 1.186 trillion bbls | 41 |
| Natural Gas | 180 trillion m3 | 67 |
| Uranium | 4.59 million ton | 85 |
Table-1 Reserve Production ratio of Fossil Fuel (BP statistics)
Global Heating
In February 2007, IPCC clearly announced that the cause of global heating is carbon dioxide emission. Stern Review suggest that if we spend 1% of GDP, we can control climate change within 2 oC. Otherwise, we might loose 5-20% of GDP. To accomplish this target we have to reduce carbon emission down to 26-32% in 2020 and 60% in 2050.
Skeptic View on Global Heating
Prof. Dr. Gerhard Gerlich who is a global warming skeptic and teaches Mathematical Physics at the Technical University Carolo-Wilhelmina in Braunschweig (Germany) published a long paper "Falsification Of The Atmospheric CO2 Greenhouse Effects Within The Frame Of Physics" in Atmospheric and Oceanic Physics 11 Sep 2007.
What I under stand from his paper is that IPCC computer model does not consider heat conduction between grey gas and air. As a result, heat transmission between earth surface and radiating upper troposphere are all done by radiation and convection only. As a result, lower temperature radiating upper troposphere is heating earth surface. This is against second law of thermodynamics.
In the following drawings, I have drawn purple arrows showing heat conduction between grey gas and air molecules. This route is missing in IPCC model. In tropospher, due to higher pressure, grey gas molecule collide with air molecules and quickly transfer heat than emitting photon. You have to consider 99% are air molecules. There are more probability for transmitting heat by Van der Waals forces than radiation. This is what I considered Chapter 5.7 of John Theodore Houghton's Physics of atmospheres, Cambridge University Press.
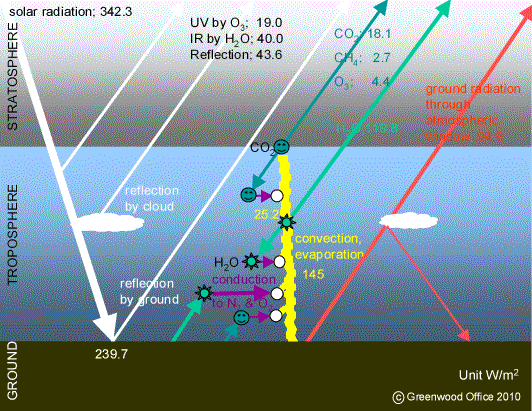
Gerlich Model
In the following diagram, I have also drawn two lines showing temperature gradient. Straight inclined red line represent IPCC and blue line showing laps rate and uniform temperature in stratosphere represent Gerlich's line.
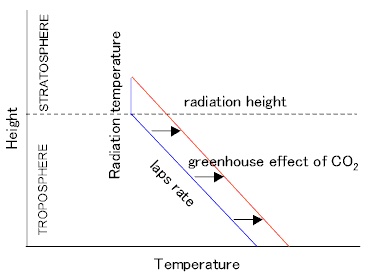
Temperature gradient
There ar many evidence of melting ice as a proof of global warming by man-made carbon dioxide. But Holocene Warm Period and Medieval Warm Period coudnot explained carbon dioxide as cause of warming. Actually, there are many proofs that in Holocene Warm Period, sea level is higher than now. In this respect, it seems for me that hypothesis of man-made warming is just a kind of religious beliefs. And I am very disappointed to find Krugman' confession of his belief in Anthropogenic Global Warming. Apparently, it seems that he is just a follower of general consensus and sitting in safely guarded arm chair. Anthropogenic Global Warming, for me, is a Copercican belief. As history teaches us a Copercican belief is always supported by a group who has power. Japanese government is driving Nuclear power using this AGW as leverage for persuading people.Water Shortage and Agriculture
Global heating will expand
Hadley cell and bring certain area no rain. This will destroy
agriculture of that region and cause political unsettle. Fritz Haber
and Carl Bosch's technology generate more carbon dioxide and accelerate
global heating.
Drought is world concern. Water is only an abundant resources in Japan. But we found this precious water was contaminated by Fukusima. Accident. My concern is false AGW concept is driving Nuc. policy in Japan. Nuc would be accepted by contry who has vast nomans land. But Japanese island is heavily inhabited and not big enough to tolerate Nuc. contaminating water. I am fighting those Nuc. Cult group saying Nuc. can resolve AGW at low cost. This is not true.
Ocean Mineral Shortage
Global heating warms up surface temperatures of ocean and natural circulation of sea water slows down. Minerals dissolved in sea water will be depleted and the sea becomes like desert where no fish lives.
World Primary Energy Substitution
Nebojsa Nakicenovic made a smart presentation of world primary energy substitution in his "Energy Strategies for Mitigating Global Change" IIASA Jan. '92. I have revised this diagram using the same methodology and reflecting the latest trend. Oil consumption curve as shown in deep blue curve in Fig.-2 is based on the Colin Campbell's estimate of 1.8 trillion bbls.
Trend of wood, coal, natural gas, nuclear, hydraulic and bio up to 1970 were taken as same as Nakicenovic diagram. IEA's predictions were used for the period between 1970 to 2030. After that, I have made it using my imagination. I have assumed that fraction of nuclear will never grow more than 0.1. Natural gas consumption profile is not symmetrical due to slow development forced by huge investment for pipeline and liquefaction facilities. For all period, coal's fraction were always decided so that the total of all fraction becomes one.
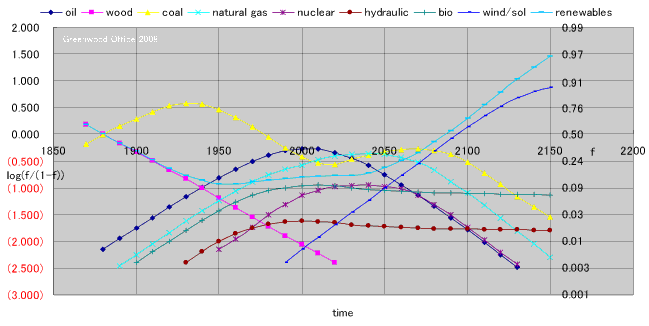
Fig.-2 Greenwood Diagram
It is interesting to find the coal consumption curve (yellow) has two peaks. If we do not do employ counter measures, global heating will be accelerated. It is also interesting to find renewables (sky blue) has bathtub curve.
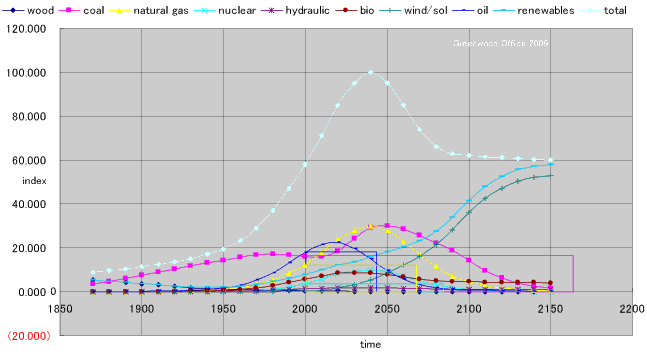
Fig.-3 Relative Consumption Diagram
Shift to Nuclear Power and to Natural Gas
As shown in Table-2, most country except France, Belgium, Germany and Sweden are considering to increase nuclear power plant.
| country | current share of nuclear power in total power generation (%) | future plan |
| USA | 22 | up |
| Canada | 19 | up |
| Russia | 16 | up |
| Ukraine | 45 | ? |
| UK | 23 | up |
| France | 80 | down |
| Belgium | 58 | down |
| Germany | 28 | down |
| Sweden | 46 | down |
| Spain | 26 | ? |
| Japan | 35 | up |
| Korea | 35 | up |
| China | 2 | up |
| India | 3 | up |
Table-2 Current share of nuclear power in total power generation and future plan
As shown in Table-3, shift to natural gas help to reduce carbon emission. Not only using natural gas for power generation and for town gas, using it for automobile fuel as CNG will help control of climate.
|
Fossil Fuel |
Carbon dioxide emission (k ton/peta jour) |
relative amount (%) |
| Oil |
21 |
100 |
| Natural Gas | 14 | 66 |
| Coal | 24 | 114 |
Table-3 Carbon dioxide emission of each Fossil Fuel
Energy Conservation by Change of Life Style
Energy conservation by change of life style is not a subject of my paper, but people will be forced to do that if carbon tax is introduced.
Improvement of Conversion Efficiency
Theoretically, increasing heat source temperature increase efficiency of power generation as shown in Fig.-3. But we could not find suitable material for construction which can withstand such high temperature.

Fig.-3 Carnot Efficiency of Power Generation Cycle
Improvement of Consumption Efficiency
Similarly, as shown in Fig.-4, theoretical power consumption of air conditioning unit improves when temperature difference for heat transfer is smaller. Currently actual COP is improved to 7 from 4. But achieving theoretical maximum figure of 43 means huge surface area exceeding our planet.
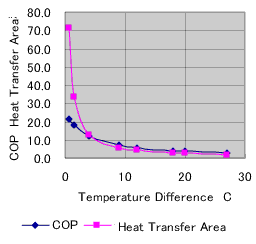
Fig.-4 COP & Surface Area of Air Conditioning Unit
Reduction of Carbon Emission from Automobule
If friction loss by air, road, piston and cylinder, and brake is zero, fuel consumption of a car also become zero. Light weight car can minimize friction loss and acceleration loss.
Prof. Ishitani, Tokyo Univ. made a comparison table of Well-to-Wheel Efficiency data of various design as Table-4.
Electric car can reduce carbon emission most. Power from nuclear plan is contributing.
| Vehicle Type | Energy Input | Well to Wheel Carbon Dioxide Emission |
|
|
MJ/km |
g-CO2/km |
| Electric Car | 0.94 |
49 |
| Fuel Cell Hybrid | 1.5 |
86.8 |
| Diesel Hybrid | 1.2 | 89.4 |
| Gasoline Hybrid | 1.7 | 123 |
| Diesel | 2.0 | 146 |
| CNG car | 2.7 | 148 |
| Gasoline | 2.7 | 193 |
Table-4 10・15mode Well-to-Wheel Efficiency data (Chemical Engineering Vol.71 No.2 2007)
Fuel cell hybrid car is the second.
I consider gasoline and diesel hybrid car are practical answer for controlling global heating. Configuration of "Prius", gasoline hybrid car is shown in Fig.-5. It has most complex mechanism but can achieve highest efficiency.

Fig.-4 Gasoline Hybrid Car (Prius)
Fuel Cell and Hydrogen Fuel
Fuel cell was not good as expected. Fuel cell itself has higher efficiency but conversion of oil into hydrogen generate carbon dioxide. Therefore, fuel cell is called fool cell.
There are many type of fuel cell. But all of them require hydrogen as shown in Table-4. Among them, Using magnesium metal as hydrogen carrier.
| Fuel | Characteristics |
| Hydrogen | Polymer electrolyte type is planned to use for auto mobile. Ceramic type, molten carbonate type and phosphoric acid type are used for larger scale fixed type installations. Even though efficiency of the fuel cell is high as 45%, if hydrogen is made from fossil fuel, well to wheel conversion efficiency is low compared to internal combustion engine. Expected life is not long enough and the cost is almost like solar cell. |
| Hydrogen carried by Metal | Using magnesium, zinc, or ferruos metal as hydrogen carrier would be a technological break through . Direct conversion of magnesium oxide to magnesium metal using YAG laser for converting solar radiation into high temperature above 20,000oC. |
| Methanol | Methanol is converted to hydrogen. Well to wheel conversion efficiency is low. |
| Ammonia | Ammonia is converted to hydrogen. Well to wheel conversion efficiency is low. |
| Hydrazine(N2H4) | Hydrazine is converted from ammonia, therefore, well to wheel conversion efficiency is low. |
| Glucose | Glucose is a product of agriculture and not suitable for energy source. |
Table-5 Type of Fuel cell
Storage and transportation of hydrogen fuel is a difficult task. High pressure vessel, adsorption to other material all have some problems.
Liquefaction of hydrogen for transportation purpose is only justified for trip to the moon. As shown in Fig.-6, power of liquefaction/heating value of methane is 23%. In case of hydrogen, it is 67%. In the process of converting oil to hydrogen, we already lost 30% of energy. This means that only 23% remains as a fuel for fuel cell.
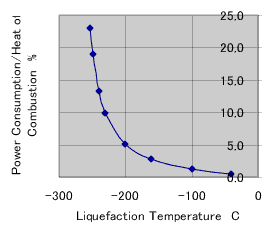
Fig.-6 Power of Liquefaction/Heating Value (methane base)
I think as far as fossil fuel are available, we will continue using them, with sequestration of carbon dioxide into ocean and producing low carbon fuel from high carbon fuel like coal. Hydrogen society may come after we depleted all fossil fuels.
Trade-Offs of Nuclear Power Plant
Radiation hot spot of Chornobyl power plant over lapped on Japan is shown in Fig.-7. Dark red color spot represent radiation over15Cl/km2. At this level, people have to evacuate for long time.
Nuclear power plant does not discharge carbon dioxide. But once we fail the containment of radioactive material within the plant, loss of life, land and real estate exceed the advantage of using the technology. Especially heavily populated country like Japan could not accept such damage.
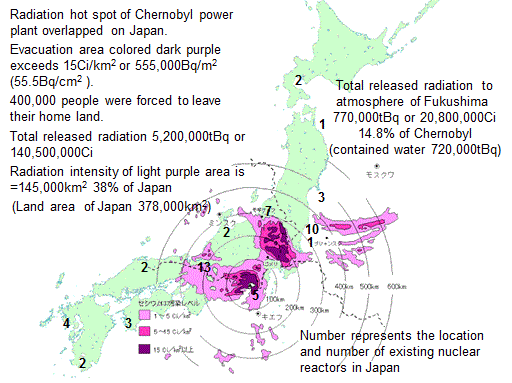
Fig.-7 Radiation Hot Spot of Chornobyl Power Plant over lapped on Japan
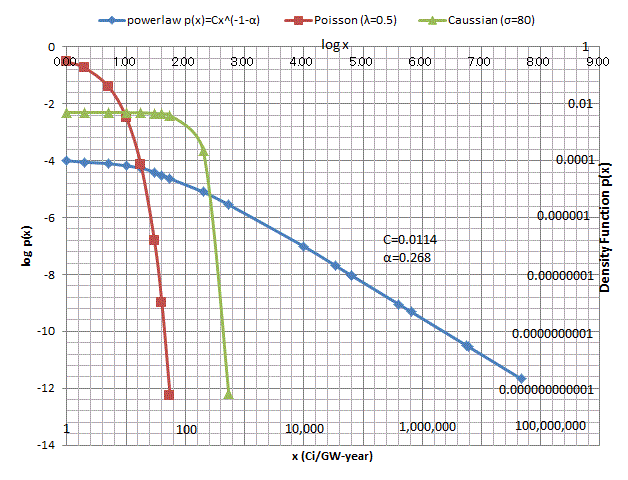
Fig.-8
historical record of accident follows power law
distribution
Falty FT Analysis of Nuclear Plant
Falty FT Analysis is one of PRA method. W. Vesely: Fault Tree
Handbook. NUREG-0492, U.S. Nuclear
Regulatory Commission, Washington DC
1981 is a good guideline.
P(t)=∫λe-λtdt=1-e-λt
When λt<0.1
AND gate
OR gate
P(A or B) ≈ P(A) + P(B), P(A ∩ B) ≈ 0
| component | λ | fission stop | cooling | containment | |||||||||
| control signal | 0.001 | | | |||||||||||
| control rod | 0.001 | |OR= | 0.002 | | | |||||||||
| boric acid | 0.01 | - | - | |AND= | 2E-05 | | | |||||||
| DC power | 0.001 | - | - | - | - | | | |||||||
| AC power | 0.01 | - | - | - | - | | | |||||||
| heat sink | 0.01 | - | - | - | - | | | |||||||
| IC or RCIC | 0.01 | - | - | - | - | |OR= | 0.031 | | | |||||
| ECCS | 0.01 | - | - | - | - | - | - | |AND= | 3E-04 | | | |||
| pool water | 0.01 | - | - | - | - | - | - | - | - | |OR= | 0.01 | | | |
| RPV | 0.5 | - | - | - | - | - | - | - | - | - | - | | | |
| PCV | 0.8 | - | - | - | - | - | - | - | - | - | - | | | |
| building | 1 | - | - | - | - | - | - | - | - | - | - | | | |
| manual operation | 1 | - | - | - | - | - | - | - | - | - | - | |AND= | 0.00412408 |
Fig.-8 FT
Analysis
In Japan, two types of nuclear reactors are used. PWR has 5 containment systems. Namely, pellet, tube, pressure vessel, containment vessel and buildings. The result of fault tree analysis is not disclosed to public. Therefore, I decided to do it by myself.
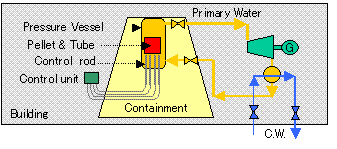
Fig.-9 PWR System
BWR also supposed to have 5 containment systems. But primary water is directly driving turbine. Therefore, primary water shut off valve and cooling water shut off valves are expected to work as containment.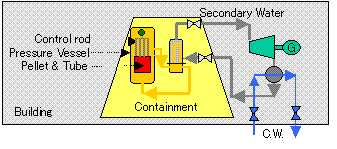
Fig.-10 BWR System
Nuclear plant can generate power about 4 yen/kWh lower than that of fossil fuel fired plant. This means 88 trillion yen savings.
Prevention of global heating by nuclear plant saves the loss of of 5-20% of GDP predicted by Sterns Review. Gain of 70-350 trillion yen was calculated from n the fact that nuclear power plant generate 11.3% of energy against primary energy of Japan.
When failure occur within 320km from Tokyo, loss of land in metropolitan area reaches 12,560 km2. If the price of land is 10,000 yen/m2, total loss of the land reaches13 trillion yen. While 10 million houses becomes inhabitable. If the price of house is 10 million yen each, total loss of houses reaches 50 trillion yen.
The cost for asylum for refugees is based on the price of house is 50 million yen each.
From this comparison, nuclear plant could not be justifiable even for stopping global heating.
| Items | Base | gain (trillion yen) | loss(trillion yen) |
| Gain from low cost power | 4 yen/kWh 1000MWx35plants over 28 years | 88 | |
| Prevention of global heating | 5-20% of GDP 11.3% of total power | 3-10 | |
| Loss of land by contamination | 12,560 km2 10,000 yen/m2 | 13 | |
| Loss of house by contamination | 5 million houses 10 million yen each | 50 | |
| Cost for asylum for refugees | 5 million houses 50 million yen each | 250 | |
|
Total |
91-98 | 313 |
Table-6 Monetary expression of Trade-Offs of BWR reactor
Above Trade-Offs does not apply for PWR reactors as reliability is far above BER.
FT Analysis of Nuclear Plant constructed on Old Seismic Criteria
In 2006, Japanese Atomic Safety Commission revised old seismic criteria which was made in 1981. All existing nuclear power plant were designed and constructed based on this criteria as shown in Table-7.
|
Power Company/Plant |
Type |
Design Criteria (gal) |
|
| Hokkaido | Tomari 1-2 | PWR | 360 |
| Tohoku | Higashidori | BWR | 320 |
| Onagawa 1-3 | BWR | 325 | |
| TEPCO | Fukushima First 1-6 | BWR | 270 |
| Fukushima Second 1-6 | BWR | 270 | |
| Kashiwazaki Kariha 1-7 | BWR | 450 | |
| Chubu |
Hamaoka 1-2 | BWR | 450 |
| Hamaoka 3-5 | BWR | 600 | |
| Hokuriku | Shiga 1-2 | BWR | 490 |
| Kansai | Mihama 1-3 | PWR | 405 |
| Takahama 1-4 | PWR | 360 | |
| Ooi 1-4 | PWR | 405 | |
| Cyugoku |
Shimane 1-2 | BWR | 398 |
| Shimane 3 | BWR | 398 | |
| Shikoku | Ikata 1-3 | PWR | 473 |
| Kyusyu | Genkai 1-4 | PWR | 275 |
| Sendai 1-2 | PWR | 372 | |
| Japan Atomic Power Co. | Tokai Second (out of service) | Graphite | 270 |
| Tsuruga 1-2 | BWR, PWR | 532 | |
Table-7 Existing Nuclear Power Plant and its Seismic Design Criteria
Recent earth quake in Niigata endangered TEPCO's Kashiwazaki Kariha plant No.1-7.
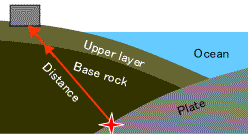
Fig.-12 Definition of Base rock and Upper layer
| Year | Earth Quake/Nuclear Power Plant | Magnitude | Distance(km) | Maximum acceleration of Base rock (gal) | Maximum acceleration of Upper layer (gal) | Record at base of building (gal) | Design criteria (gal) |
| January 1995 |
South Hyogo/Kobe |
7.3 |
16 |
420 |
847 |
880 |
- |
| July 2007 | Chyuetsu Oki/Kariha | 6.8 |
23.3 |
179 | 409 | 680 | 450 |
|
x year |
Tokai/Hamaoka | 8.5 |
36.1 |
800 | 1,835 | - |
800 |
Table-8 Predicted acceleration and Record
Luckily, it was still within design criteria and safely shut down. But big question remained on existing power plant in operation. Chubu's Hamaoka plant No.1-2 are considered most dangerous plant in Japan, as it stands just above plate type earthquake center. In addition, the plant is using old BWR type reactor.
I have made similar FT analysis for this plant. It was summed that earth quake occurs in every 150 years and that plant plant life is 30 years. In this case reliability of containment system , cable and shut off valve vecoms r=1-30/150=0.8.
| primary water=0.66 | | | ||||
| secondary water=0.66 | | | ||||
| cable=0.8 | |AND=0.34848 | | | |||
| |AND=0.33478334208 | | | ||||
| control rod=0.66 | |OR=0.960696 | | | | | ||
| boracic acid=0.66 | | | pellet=0.8 | | | ||
| emergency cooling=0.66 | | | tube=0.8 | |OR=0.998935653134 | | | |
| pressure vessel=0.8 | |AND=0.79999996 | | | | | ||
| ductility=0.99999995 | | | | | | | ||
| containment=0.8 | | | |AND=0.511455054405 | | | ||
| steam shut off valve=0.8 | | | | | |||
| water shut off valve=0.8 | | | |OR=0.902291010881 | |||
| cable=0.8 | | | | | |||
| building=0.8 | | |
Fig.-13 FT Analysis of BWR constructed on Old Seismic Criteria
Reliability R=902291010881 means that failure probability is 1/10 of the earthquake. This figure is not acceptable to the society.
Nuclear Plant Mounted on Semi-submersibles
If nuclear power plant is installed on semi-submersibles, creating large scale refugee from radio active contamination of land could be avoided. International agreement is necessary for this scheme. If cold sea water taken from 1,000m depth is also utilized for surface condenser, additional power could be extracted from the plant. Generated power is transmitted via direct current cables.
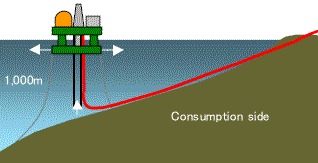
Fig.-14 Nuclear Plant Mounted on Semi-submersibles
Nuclear Power Plant in Remote Location
For the purpose of drastic reduction of carbon dioxide, nuclear power plant is very effective. But installing nuclear plant near heavily populated area like Japan brings risks equal to that of climate change. Therefore, such facilities should be installed in remote place. If we can find such place, even steel mill could be run on hydrogen from nuclear plant.
Please note that R/P of Uranium is in the same order like fossil fuel. Therefore, we cannot rely on this energy source very much.
Sequestration of Carbon Dioxide and Production of Low Carbon Fuel
There are many types of sequestration of carbon dioxide. Onshore underground storage by direct injection into depleted oil or gas field and or water bearing stratum is suitable for continental country like USA. But potential site is limited for a country like Japan. Direct injection into deep sea or limestone neutralization are most promising for a ocean country like Japan. But the technology are still under investigation. I have listed all available technologies in Table-9 after reading IPCC Special Report on Carbon dioxide Capture and Storage published in 2006.
| Type | Characteristics | Cost ($/ton CO2) |
| Onshore underground storage | Injection into depleted oil or gas field and or water bearing stratum. Capacity is limited. Accidental leakage risks. |
0.4 - 4.5 |
| Under seabed storage | Injection into water bearing stratum under sea floor of 1,000m depth. Internationally agreed in November 2006 in London. Capacity is limited. |
4.7-12 |
|
Natural absorption to ocean |
Ocean capacity is big enough to accept all carbon dioxide from fossil fuel. But ocean surface become acidic and destroy life in ocean. A couple of thousand years are required to reach equilibrium. |
0 |
| Direct injection into deep sea | Direct injection to sea floor of about 2,000-2,500m depth. Ocean capacity is big enough to accept all carbon dioxide from fossil fuel. Carbon dioxide lakes or hydrate on sea floor may be formed. Environmental effect is still under investigation. | 11.9 |
| Limestone neutralization | After neutralization by lime stone slurry, calcium bicarbonate is discharged to the ocean. Ocean capacity is big enough to accept all carbon dioxide from fossil fuel. Lime stone resources is 10,000times bigger than fossil fuel. Contamination by impurities in lime stone is not well known but increased mineral may enhance fishing business. | 10-110 |
Table-9 Sequestration of Carbon Dioxide
According to Chapter 6 of IPCC Special report on Ocean storage written by Ken Caldeira and Makoto Akai, ocean surface is supersaturated with respect to calcite at atmospheric pressure (solubility increases with depth). When carbon dioxide is added to sea water, following neutralization keeps the pH of sea water.
CaCO3(s) + CO2(g) + H2O ⇔ Ca2+ + 2HCO3-
Path of neutralization are shown in Fig.-17.
But too much of carbon oxide consume all calcite. Therefore it is needed to add calcite (lime stone) to the sea. This is the principle of sequestration of carbon dioxide with limestone neutralization.
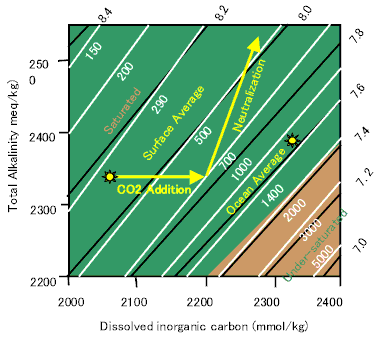
Fig.-17 Path of Neutralization (Baes 1982)
If we can adopt ocean sequestration, we can use coal without changing world climate. Although a bit costly, Limestone neutralization seems promising as it does not put marine lives in danger.
As shown in Fig.-19, the same method could be used for low carbon fuel synthesis with sequestration of carbon dioxide.
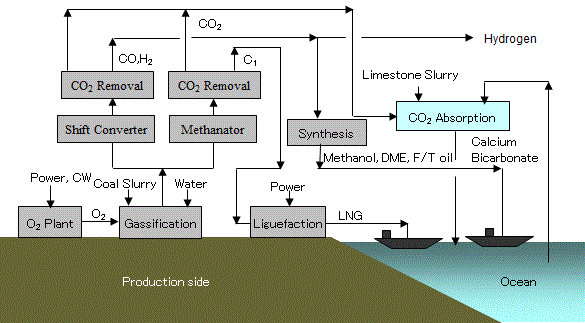
Fig.-19 Low Carbon Fuel Synthesis with Sequestration of Carbon Dioxide
Carbon dioxide from synthesized low carbon fuel from coal are shown in Table-10. Carbon dioxide from synthesis process is sequestered and does not change climate. When all synthetic fuel is burned in large power plant near ocean, again carbon dioxide from power generation could be sequestered as well.
| Synthetic. Fuel | Energy Shrink in Synthesis(%) | Power Generation Efficiency (%LHV) | Carbon Dioxide from Synthesis Process (kg/kW) | Carbon Dioxide from Power Generation (kg/kW) |
| LNG | 10 | 55 | 0.041 | 0.365 |
| DME | 29 | 55 | 0.0803 | 0.434 |
| LPG | marginal | 55 | marginal | 0.447 |
| Methanol | 35 | 55 | 0.110 | 0.452 |
| F/T Middle Distillate | 40 | 40 | 0.164 | 0.717 |
Table-10 Carbon Dioxide Emission from Synthesis process of Low Carbon Fuel from Coal and its consumption
Only when those fuels are used for automobile fuel, carbon dioxide is emitted into atmosphere. But even so, as seen in Table-11, well to wheel carbon dioxide emission are remarkably low.
| Vehicle Type | Energy Input | Well to Wheel Carbon Dioxide Emission |
|
|
MJ/km |
g-CO2/km |
| Electric Car | 0.94 |
49 |
| Fuel Cell Hybrid | 1.5 |
86.8 |
|
DME Diesel Hybrid |
1.2 |
54.1 |
| Diesel Hybrid | 1.2 | 89.4 |
| CNG Hybrid | 1.7 | 62.6 |
| Gasoline Hybrid | 1.7 | 123 |
| DME Diesel | 2.0 | 88.4 |
| Diesel | 2.0 | 146 |
| CNG Car | 2.7 | 148 |
| Gasoline | 2.7 | 193 |
Table-11 10・15mode Well-to-Wheel Efficiency data using Low Carbon fuel produced with Ocean Sequstering
When the cost of carbon capture and sequestration is not included.
| Renewable Energy | Power Cost | Operating Factor |
| yen/kWh | - | |
| Wind | 9.57 | 0.25 |
| PV | 25.44 | 0.3163x0.4=0.1265 |
| Trough CSP with Thermal Accumulator in Japan | 18.00 | 0.667x0.4x0.9=0.240 |
| Trough CSP with Thermal Accumulator in Sun Belt | 10.29 | 0.667x0.7x0.9=0.420 |
| Nuclear Power | 11.48 | 0.8 |
Renewable Energy Coat and Operating Factor
|
Renewable Energy |
Wind | Wind | PV | Trough CSP with Thermal Accumulator | Nuclear Power | |
|
Conversion Site |
Japan | Japan | Japan | Japan | Sun Belt | Japan |
|
Converted fuel |
Hydrogen | Ammonia | Ammonia | Ammonia | Ammonia | Ammonia |
| Construction Cost (yen/W) | 140 | 140 | 140 | 140 | 140 | 140 |
| Internal consumption (%) | 0 | 5 | 5 | 5 | 5 | 5 |
| Operating factor (%) | 0.25 | 0.25 | 0.1265 | 0.24 | 0.42 | 80 |
| Conversion Eff. (%) | 80 | 83 | 83 | 83 | 83 | 83 |
| Annual Conversion (kWh/y) | 1,752 | 1,727 | 874 | 1,658 | 3,054 | 5,526 |
| Discounted Capital Cost(%/y) | 19.05 | 19.05 | 19.05 | 19.05 | 19.05 | 19.05 |
| Capital Cost/Annual Conversion (yen/kWh) | 15.22 | 15.44 | 30.51 | 16.09 | 8.73 | 4.83 |
| Lost Power (yen/kWh) | 1.91 | 2.10 | 5.60 | 3.96 | 2.26 | 2.53 |
| Conversion Cost (yen/kWh) | 17.12 | 17.54 | 36.11 | 20.05 | 10.99 | 7.36 |
| Renewable Energy Cost (yen/kWh) | 9.57 | 9.57 | 25.44 | 18.00 | 10.29 | 11.48 |
| Converted Fuel Cost (yen/kWh) | 26.69 | 27.11 | 61.55 | 38.05 | 21.28 | 18.84 |
Conversion of Renewable Energy to Ammonia Fuel
What I am trying to point out is that if we assume recoverable fossil fuel is about 2 times of BP statistics, Peaking out time of oil, gas and coal and nuclear are 2020, 2050, 2050 and 2080 respectively. After that, we have to rely on mainly solar energy as primary energy. Then the question is what would be the secondary energy except electricity. My answer is Ammonia.
| Primary Energy | Secondary Energy | Power Train | CIF Price | LHV | Capital Charge | Energy Cost | Distribution | Fuel Cost | Thermal Eff. | Fuel Cost per Shaft Power |
| yen/ton | kcal/g | yen/kWh | yen/kWh | % | yen/kWh | |||||
| Crude | Gasoline | Hybrid | 120yen/l (sg 0.73)164,000 | 10.6 | 9.0 | 9.0 | 37 | 24.3 | ||
| Natural Gas | CNG | Hybrid | 40,000 | 13.3 | 2.59 | 5 | 7.57 | 37 | 20.5 | |
| Natural gas & Crude | LPG | Hybrid | 100,000 | 12.0 | 7.16 | 7.16 | 37 | 19.4 | ||
| Natural Gas | DME | Hybrid | 240$/ton | 8.8 | 2.35 | 5 | 7.35 | 37 | 19.9 | |
| Natural Gas | Methanol | Hybrid | 200$/ton | 5.6 | 3.07 | 5 | 8.07 | 37 | 21,8 | |
| Natural Gas | Harbor Bosh Synthesis Ammonia excl. CCS | Hybrid | 200-415$/ton | 5.37 | 3.20 to 6.64 | 5 | 8.2 to 11.64 | 37 | 22.2 to 31.5 | |
| Grid Power(3.5cent/kWh) | Ammonia | Hybrid | 315$/ton | 5.37 | 5.04 | 5 | 10.04 | 37 | 27.1 | |
| Wind (9.6yen/kWh) | Ammonia | Hybrid | - | 5.37 | 15.4 | 9,6+2.1 | 5 | 32.1 | 37 | 86.8 |
| Trough CSP with Thermal Accumulator in Japan (18yen/kWh) | Ammonia | Hybrid | - | 5.37 | 16.1 | 18.0+4.0 | 5 | 43.1 | 37 | 116.5 |
| Trough CSP with Thermal Accumulator in Sun Belt (10.3yen/kWh) | Ammonia | Hybrid | - | 5.37 | 8.7 | 10.3+2.3 | 5 | 26.3 | 37 | 71.1 |
| Nuclear Power (11.5yen/kWh) | Ammonia | Hybrid | - | 5.37 | 4.8 | 11.5+2.5 | 5 | 23.8 | 37 | 64.3 |
| Current Grid Power (23.0yen/kWh) | Battery (charge once in a day) | Motor | - | - | 16.2 | 23.0+3.5 | 0 | 42.7 | 98 | 43.6 |
| Grid Power after introduction of Renewables (36.0yen/kWh) | Battery (charge once in 3 days) | Motor | - | - | 23.7 | 36.0+4.5 | 0 | 64.2 | 98 | 65.5 |
Various Fuel for Automobile
distribution cost of 5yen/kWh was assumed
CSP: Concentrating Solar Power
CCS: Carbon capture and sequestration
As battery is charged and discharged daily,
Battery Cost per kW (yen/kW))=Battery Cost per day(yen/kWh)/25h
Then storage cost is calculated by following equation.
Storage Cost=(Capital Related
Charge)/Annual Recovered Power + Lost Power (yen/kWh)
Annual Recovered Power=1kWh/d x 365d/y x Availability x Load Factor x
Recovery Eff. (kWh/y)
Lost Power=Charge Power Cost x (1-Revovery
Eff.) (yen/y)
Capital Related Charge=Battery Cost (yen/kW) x Discounted Capital
Charge Factor (yen/y)
NOx control could be achieved by low temperature combustion.
| PV Back up | Battery Car | |||||
|
Type of Battery |
Lead | NAS | Lithium Ion | Lithium Ion | Lithium Ion | Lithium Ion |
|
cycle numbers in a day |
1 | 1 | 1 | 1 | 0.3 | 0.3 |
|
battery life (year) |
3 | 7 | 3 | 3 | 9 | 9 |
| Battery Cost (yen/kWh) | 50,000 | 25,000 | 100,000 | 100,000 | 100,000 | 100,000 |
| Battery Cost (yen/kW) | 2,083 | 1,042 | 4,167 | 4,167 | 4,167 | 4,167 |
| Availability (%) | 100 | 100 | 100 | 80 | 80 | 80 |
| Load Factor (%) | 12.6 | 12.6 | 12.6 | 33.3 | 10 | 10 |
| Recovery Eff. (%) | 80 | 75 | 85 | 85 | 85 | 85 |
| Discounted Capital(%/y) | 40.24 | 20.86 | 40.24 | 40.24 | 17.65 | 17.65 |
| Annual Recovered Power (kWh/y) | 36.8 | 34.5 | 39.1 | 103.3 | 31.0 | 31.0 |
| Capital Cost/Annual Recovered Power (yen/kWh) | 22.8 | 6.3 | 42.9 | 16.2 | 23.7 | 23.7 |
| Lost Power (yen/kWh) | 4.6 | 5.8 | 3.5 | 3.5 | 3.5 | 4.5 |
| Charge Power Cost (yen/kWh) | 23.0 | 23.0 | 23.0 | 23.0 | 23.0 | 36.0 |
| Power Storage Cost (yen/kWh) | 27.4 | 12.1 | 46.4 | 19.7 | 27.2 | 28.2 |
| Battery Power Cost (yen/kWh) | 50.4 | 35.1 | 69.4 | 42.7 | 50.2 | 64.2 |
Battery Cost
NAS: Sodium-sulfur battery
Renewable Energy
When final coal is depleted, solar energy would be the only means of our survival on this planet
Agriculture
Food supply is more important than energy, therefore agriculture no longer can supply energy. It is also important to supply material for clothes and houses.
Forestry
Destroying forest for agriculture also must to stop for keeping biodiversity, therefore we could not rely on forestry.
Biomass Recycle as Energy
Utilizing biomass recycle as energy source is most recommended. Used timber for house, garbage from community should be utilized for bio fuel
Solar Cell or Artificial Photosynthesis
Solar cell or artificial photosynthesis would be the most important technology in the latter half of 21st Century and in 22nd Century.
Artificial Photosynthesis still could not give good performance. But solar cell proved to give us more than 10% conversion efficiency. This is almost 10 times of that of Agriculture. There are many types of solar cells. But most of them are based on p-n bonding of semi conducting material. Crystal silicon can give us highest efficiency, but other material are less costly and can give us reasonable conversion.
| Type | Characteristics |
| Crystal Silicon | A p-n bonding of crystal silicon can achieve conversion efficiency of 15-17%. Long life. |
| Thin film | A thin film of p-n bonding of crystal silicon can achieve conversion efficiency of 10-12%. |
| Amorphous Silicon | Low cost, but low efficiency of 6% and short life. |
| Metal Compound | Thin film of metal compound of cupper, -indium,-gallium-selenium (CIGS) can achieve conversion efficiency of 11% |
| Dye-Sensitized Solar Cell (DSC) | It is also called as wet solar cell or Graetzel cell and can achieve conversion efficiency of 10%. Still short life. |
| Organic thin film | A p-n bonding of organic semi conducting film can achieve conversion efficiency of 4%. |
Table-12 Type of Solar Cell
When 3.3kW solar cells were installed on the roof of all houses in Japan, about 10% of power consumption will be supplied by them.
Energy Storage for Solar cell
Solar cell need energy storage device for night time use. If solar cell capacity is less than 10%, grid can absorb. When capacity expand more than that, several option could be considered as shown in Table-13. For comparison, energy density of oil is 10kWh/liter and size is 1,000-10,000MW.
|
method |
characteristics |
| Connection to Grid | Possible up to 10% of grid capacity |
| Pumping Power Generation Dam | energy density 0.001kWh/liter, size 100-1,000MW, 200,000-600,000yen/kW |
| Storage as Hydrogen Gas and fuel cell for power generation | energy density 0.004kWh/liter, size 0.1-100MW, 1,000,000yen/kW |
| Super Conducting Force Balanced Helical Coil | energy density 0.01kWh/liter, size 10-1,000MW, 400,000-2,400,000yen/kW |
| Fly Wheel | energy density 0.1kWh/liter, size 1-10MW, 400,000-1,200,000yen/kW |
| Secondary Battery like Lithium ion | energy density 0.2kWh/liter, size 0.1-100MW, 2,400,000yen/kW |
Table-13 Energy Storage for Solar Cell Petrotech 2008 Vol31 No.2
Other Renewable Energy
Other renewable energy are hydraulic power, geothermal, wind power, ocean temperature difference, tidal, and solar heat. In Japan, hydraulic power plant supply about 9% of total power. Wind power generation has potential capability of 7-10% on land and 3% along shore line. But currently, it is restricted below 1% by law.
As Japan has steep sea bed, installing wind form on semi-submersibles would be most feasible way. Power generation cost is 16.6yen /kWh.
I had proposed Power Generation by Artificial Typhoon and proposed in a International Workshop on Hybrid Solar Systems held in Rifugio Passo Sella from 20 to 24 of September 2005.
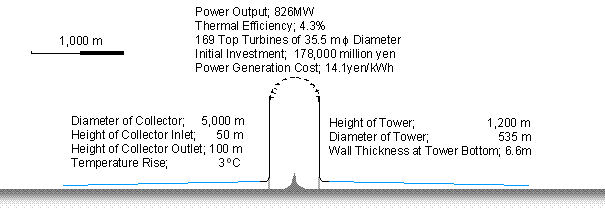
Fig.-22 Power Generation by Artificial Typhoon
Solar Heat
In addition to active solar house having solar cells and water heater on the roof, passive solar house which control window opening and having heat accumulation body with it will be utilized.
It is also possible to generate power from steam generated by gathered rays of solar light. If heat is collected by chemical reaction, power could be generated when required at night time after storage of heat. In this case, separate energy storage device is not needed.
Air Conditioning Unit by Solar Cell
New type of air conditioning unit which accumulate ice in daytime using solar power and use it during night and day would be feasible.
Town Gas (Hydrogen or Methane or Mixture of both)
I think even after depleting fossil fuel,
and if town gas is needed, methane gas is still used as convenient
carrier of energy. It may be either mixed with hydrogen or as pure
methane. This methane is synthesized from hydrogen and carbon dioxide.
Present Statue of Japan and the World
As shown in Table-14, achieving Kyoto protocol in 2012 might be very difficult. In 2005, carbon emission increased about 7.8% instead of minus 6%.
|
Sector |
Emission in 1990 (million ton/y) |
Reduction in 2005 (%) |
| Industrial | 482 | -5.5 |
| Office and Others | 164 | +44.6 |
| Home | 127 | +36.7 |
| Transportation | 217 | +18.2 |
| Energy Conversion | 67.9 | +15.7 |
| Carbon Dioxide from non energy related | 85.1 | +6.6 |
| Methane, Nitrous Oxide, Fluorocarbon | 117.2 | -45.6 |
| Total | 1,261 | +7.8 |
Table-14 Carbon Emission by Sector in Japan
Performance of Germany, UK, Sweden, and Denmark are excellent. But other country have problems as shown in Table-15. No data are available from USA.
| Country | Emission in 2005/1990 (%) |
| Germany | -18.5 |
| UK | -14.8 |
| Sweden | -7.3 |
| Denmark | -7.0 |
| France | -1.6 |
| Japan | 7.8 |
| Italia | 12.1 |
| New Zealand | 24.7 |
| Canada | 25.3 |
| Australia | 25.6 |
| Spain | 53.3 |
Table-15 Trend by Country 2005
Table-16 shows relative amount of carbon emission of major country. It is said that China had exceed USA in 2007. It is evident without those two, global heating is uncontrollable.
| Country | Emission in 2004 (%) |
| USA | 22.1 |
| China | 18.1 |
| EU | 12.8 |
| Russia | 6.0 |
| Japan | 4.8 |
| India | 4.3 |
| Remaining Country | 31.9 |
Table-16 Carbon Emission by major Country in 2004
Conclusion
Introduction of carbon tax and regulation controlling carbon emission is prime importance.
January 10, 2008
Rev. April 15, 2012