Imaging with LabVIEW (IG_TIFF.llb)
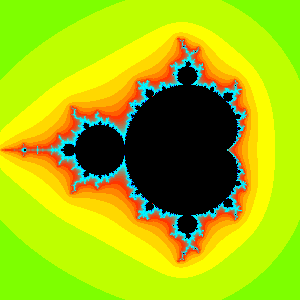
LabVIEW is not only useful tool for measurement and control, but also useful for analysis and simulation. When you use intensity graph on your analysis panel, you might want to save the result as a graphic file. Or you might want to load your graphic data into LabVIEW to analyze it. For example, when you calculate and display Mandelbrot set and want to use the figure in your word processor, you need general file format to save.

Although there are many kind of graphic file format, my choice is TIFF. Because TIFF format is supported by major graphic programs and it has no platform limitations.
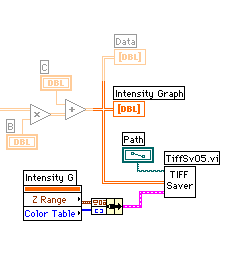
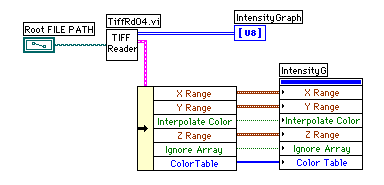
LabVIEW Intensity graph is 256 color system and you can change color map by color array or programatically. The data type is not limited to U8. TIFF Saver VI need to know graph attributes and should contain data converter. TIFF Reader should set color map through attributes.

VI size 331.9K


VI size 405.0K

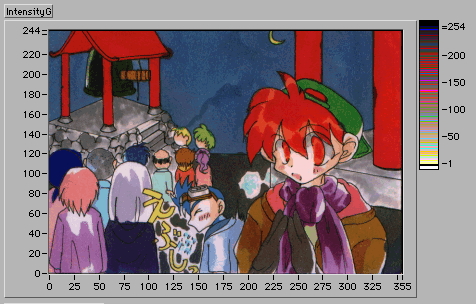
Even 256 colors you can see good graphics on LabVIEW intensity graph! (Loaded scanned image of My daughter's hand drawing on LabVIEW panel.
