
PRO/II Process Simulation
Natural Gas Liquefaction
by
Multiple Turbo Expander
Cycle
by
Greenwood
![]()
| |
PRO/II Process SimulationNatural Gas LiquefactionbyMultiple Turbo Expander
Cycle
|
|
Floating natural gas liquefaction plant will be used
more for remote small gas field or for off shore gas develoment. In
such case, safety becomes very important. Normally, mixed refrigerant
is
used for onshore plant for its economy. Turbo expander cycle using
nitrogen gas as refrigerant is inferior in terms of thermal efficiency,
but it is safer when leakage occurs.
Land based plant use brazed aluminum heat exchangers (BAHE) but it is more preferable to use BAHE only for nitrogen circuit. But for natural gas circuit, spiral wound heat exchangers would be prefarable for natural gas cooling by nitrogen. In this case, bottom cool design would be used for spiral wound heat exchangers.
Advantage of this system is no two phase flow inlet to each heat exchanger.
The Purpose of simulation
The purpose of simulation is to find out thermal efficiency of this system using PRO/II.
Feed Gas Condition
Feed gas condition was taken exactly same as that of Natural Gas Liquefaction by Mixed Refrigerant (MR) in Brazed Aluminum Exchanger (Distillation Effect)Total Feed gas 6,000kgmol/h (roughly 100ton/h)
Composition:
|
Component |
mol % |
| Nitrogen | 1 |
| Methane | 93 |
| Ethane | 3 |
| Propane | 2 |
| Butane | 1 |
Feed pressure: 60 Bar G
Feed temperature: 40oC
Simulation Model
Basically, the process repeats same scheme 3 times for
desuper heatibng zone (40 to -30C), condensing zone (-30 to -100C) and
sub cooling zone (below -100C) of the natural
gas as illustrated below.
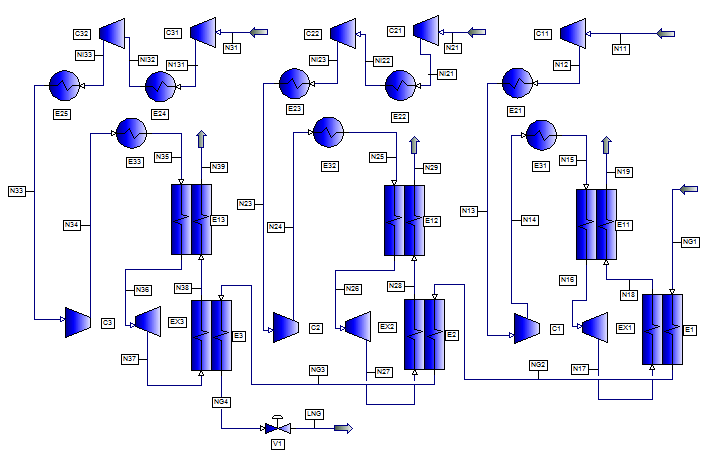
PRO/II model
Pressure drop of each heat exchanger was taken as 0.2Bar.
Heat loss of exchanger was taken as 3%.
Nitrogen Compressor Adiabatic efficiency: 80%
Expander adiabatic efficiency: 90%
Outlet temperature of all water coolers:40C
Nitrogen suction temperature to C11, C21, C31 compressor temperature: 30C.
Nitrogen compander suction temperature to C1, C2, C3, C22, C32compressor temperature 40C.
Inter cooler are required for C21-C22 and C31-C32.
Each heat exchanger were divided into 10 zones to check minimum temperature When zone analysis is requested for each LNG exchanger, and data review window in output pull down menu is opened, internal temperature difference such as zone MITA and mean temperature difference could be viewed after each trial run.
Calculation Results
This is not an optimum composition. You might find a better set of operating conditions as there are unlimited combinations to achieve good match of composite cooling curve.C11 compressor: suction volume: 23,098m3/h,
power consumption: 5,227kW, discharge/suction pressure: 17.9/9.9BarG.
C21 compressor: suction volume: 216,291m3/h (1.4 time of 1 st.stage MR compressor), power consumption: 13,862kW, discharge/suction pressure: 4.2/1.9BarG.
C22 compressor: suction volume: 129,882m3/h, power consumption: 12,015kW, discharge/suction pressure: 7.205/4.0BarG.C31 compressor: suction volume: 130,206m3/h, power consumption: 11,128kW,discharge/suction pressure: 5.0/1.6BarG.
C32 compressor: suction volume: 60,488m3/h, power consumption: 10,241kW, discharge/suction pressure: 11.3/4.8BarG.C1 compressor: suction volume: 13,938m3/h, power consumption: 6,249kW
EX1 expander discharge volume: 17,315m3/h, power generation: 6,275kW
C2 compressor: suction volume 80,773m3/h, power consumption: 15,238kW
EX2 expander discharge volume 104,894m3/h, power generation: 15,232kW
C3 compressor: suction volume 29,046m3/h, power consumption: 7,311kW
EX3 expander discharge volume 40,461m3/h, power generation: 7,300kW
Total power consumption: 52,472kW
For reference, total power consumption of MR cycle is
39,747kW. Therefore Expander/MR power ration is 1.32.
Total liquid mol fraction after flash: 0.9344
6.56mol % of flash gas is compressed and used as dryer regeneration gas and then plant fuel to drive compressors.
LNG products quantity: 98.6ton/h (790,000ton/y)
Power consumption per ton of LNG: 532kWh/ton LNG or
22.2W/(tonLNG/day).
For reference, MR cycle power consumption per ton of
LNG is 403kWh/ton LNG or
16.8kW/(tonLNG/day).
This means that further optimization, is required.
Plant fuel for power generation: 158kg (When power cycle efficiency: 30%, heat of combustion of methane:890kJ/mol, MW:16.04, J=Ws )
For reference, plant fuel for power generation: 120kg (When power cycle efficiency: 30%, heat of combustion of methane: 890kJ/mol, MW: 16.04, J=Ws )
Overall efficiency: 88.5%.
For reference overall efficiency of MR cycle is 91.3%
Stream properties
Following table is an output of PRO/II.
| stream
name |
NG1 |
NG1 | NG1 | NG1 | LNG |
N17 |
N18 |
N27 |
N28 |
N37 |
N38 |
||
| Phase | Vapor | Vapor | Liquid | Liquid | Mixed | Vapor | Vapor | Vapor | Vapor | Vapor | Vapor | ||
| Total Stream Properties | |||||||||||||
| Rate | KG-MOL/HR | 6000.000 | 6000.000 | 6000.000 | 6000.000 | 6000.000 | 10000.000 | 10000.000 | 25000.000 | 25000.000 | 13500.000 | 13500.000 | |
| KG/HR | 105390.936 | 105390.936 | 105390.936 | 105390.936 | 105390.936 | 280134.792 | 280134.792 | 700336.981 | 700336.981 | 378181.970 | 378181.970 | ||
| Std. Liquid Rate | K*M3/HR | 0.332 | 0.332 | 0.332 | 0.332 | 0.332 | 0.347 | 0.347 | 0.867 | 0.867 | 0.468 | 0.468 | |
| Temperature | C | 40.000 | -30.000 | -100.000 | -155.275 | -161.655 | -35.236 | 34.622 | -103.742 | -39.381 | -159.732 | -105.524 | |
| Pressure | BAR(GA) | 60.000 | 59.800 | 59.600 | 59.400 | 0.000 | 10.300 | 10.100 | 2.300 | 2.100 | 2.000 | 1.800 | |
| Molecular Weight | 17.565 | 17.565 | 17.565 | 17.565 | 17.565 | 28.013 | 28.013 | 28.013 | 28.013 | 28.013 | 28.013 | ||
| Enthalpy | MM KCAL/HR | 5.832 | 0.845 | -10.186 | -15.303 | -15.303 | -5.092 | -0.105 | -24.326 | -12.954 | -18.545 | -13.275 | |
| KCAL/KG | 55.338 | 8.020 | -96.647 | -145.198 | -145.198 | -18.178 | -0.376 | -34.734 | -18.497 | -49.038 | -35.102 | ||
| Total Liquid Fraction | 0.0000 | 0.0000 | 1.0000 | 1.0000 | 0.9343 | 0.0000 | 0.0000 | 0.0000 | 0.0000 | 0.0000 | 0.0000 | ||
| Reduced Temp. | 1.5713 | 1.2201 | 0.8688 | 0.5915 | 0.5595 | 1.8852 | 2.4388 | 1.3424 | 1.8524 | 0.8987 | 1.3283 | ||
| Pres. | 1.3321 | 1.3278 | 1.3234 | 1.3190 | 0.0221 | 0.3327 | 0.3269 | 0.0974 | 0.0916 | 0.0886 | 0.0827 | ||
| Acentric Factor | 0.0191 | 0.0191 | 0.0191 | 0.0191 | 0.0191 | 0.0377 | 0.0377 | 0.0377 | 0.0377 | 0.0377 | 0.0377 | ||
| Watson K (UOPK) | 18.874 | 18.874 | 18.874 | 18.874 | 18.874 | 6.408 | 6.408 | 6.408 | 6.408 | 6.408 | 6.408 | ||
| Standard Liquid Density | KG/K*M3 | 317017.474 | 317017.474 | 317017.474 | 317017.474 | 317017.474 | 807960.347 | 807960.347 | 807960.347 | 807960.347 | 807960.347 | 807960.347 | |
| Specific Gravity | 0.3173 | 0.3173 | 0.3173 | 0.3173 | 0.3173 | 0.8088 | 0.8088 | 0.8088 | 0.8088 | 0.8088 | 0.8088 | ||
| API Gravity | 314.408 | 314.408 | 314.408 | 314.408 | 314.408 | 43.460 | 43.460 | 43.460 | 43.460 | 43.460 | 43.460 | ||
| Latent Heat | KCAL/KG | n/a | n/a | n/a | n/a | 119.620 | n/a | n/a | n/a | n/a | n/a | n/a | |
| Vapor Phase Properties | |||||||||||||
| Rate | KG-MOL/HR | 6000.000 | 6000.000 | n/a | n/a | 394.262 | 10000.000 | 10000.000 | 25000.000 | 25000.000 | 13500.000 | 13500.000 | |
| KG/HR | 105390.936 | 105390.936 | n/a | n/a | 6802.737 | 280134.792 | 280134.792 | 700336.981 | 700336.981 | 378181.970 | 378181.970 | ||
| M3/HR | 2322.020 | 1448.364 | n/a | n/a | 3499.727 | 17315.119 | 23036.779 | 104893.713 | 155599.719 | 40461.686 | 66111.514 | ||
| Std. Vapor Rate | M3/HR | 142142.648 | 142142.648 | n/a | n/a | 9340.247 | 236904.413 | 236904.413 | 592261.034 | 592261.034 | 319820.958 | 319820.958 | |
| Specific Gravity (Air=1.0) | 0.606 | 0.606 | n/a | n/a | 0.596 | 0.967 | 0.967 | 0.967 | 0.967 | 0.967 | 0.967 | ||
| Molecular Weight | 17.565 | 17.565 | n/a | n/a | 17.254 | 28.013 | 28.013 | 28.013 | 28.013 | 28.013 | 28.013 | ||
| Enthalpy | KCAL/KG | 55.338 | 8.020 | n/a | n/a | -39.586 | -18.178 | -0.376 | -34.734 | -18.497 | -49.038 | -35.102 | |
| CP | KCAL/KG-C | 0.622 | 0.817 | n/a | n/a | 0.467 | 0.257 | 0.253 | 0.254 | 0.251 | 0.261 | 0.253 | |
| Density | KG/M3 | 45.388 | 72.765 | n/a | n/a | 1.944 | 16.179 | 12.160 | 6.677 | 4.501 | 9.347 | 5.720 | |
| Thermal Conductivity | KCAL/HR-M-C | 0.03011 | 0.02205 | n/a | n/a | 0.01070 | 0.01813 | 0.02250 | 0.01352 | 0.01786 | 0.00938 | 0.01339 | |
| Viscosity | CP | 0.01151 | 0.00923 | n/a | n/a | 0.00479 | 0.01486 | 0.01815 | 0.01124 | 0.01465 | 0.00786 | 0.01114 | |
| Liquid Phase Properties | |||||||||||||
| Rate | KG-MOL/HR | n/a | n/a | 6000.000 | 6000.000 | 5605.738 | n/a | n/a | n/a | n/a | n/a | n/a | |
| KG/HR | n/a | n/a | 105390.936 | 105390.936 | 98588.199 | n/a | n/a | n/a | n/a | n/a | n/a | ||
| K*M3/HR | n/a | n/a | 0.233 | 0.180 | 0.167 | n/a | n/a | n/a | n/a | n/a | n/a | ||
| Std. Liquid Rate | K*M3/HR | n/a | n/a | 0.332 | 0.332 | 0.312 | n/a | n/a | n/a | n/a | n/a | n/a | |
| Specific Gravity (H2O @ 60 F) | n/a | n/a | 0.3173 | 0.3173 | 0.3162 | n/a | n/a | n/a | n/a | n/a | n/a | ||
| Molecular Weight | n/a | n/a | 17.565 | 17.565 | 17.587 | n/a | n/a | n/a | n/a | n/a | n/a | ||
| Enthalpy | KCAL/KG | n/a | n/a | -96.647 | -145.198 | -152.485 | n/a | n/a | n/a | n/a | n/a | n/a | |
| CP | KCAL/KG-C | n/a | n/a | 1.011 | 0.807 | 0.817 | n/a | n/a | n/a | n/a | n/a | n/a | |
| Density | KG/K*M3 | n/a | n/a | 451807.947 | 584599.025 | 591588.347 | n/a | n/a | n/a | n/a | n/a | n/a | |
| Surface Tension | DYNE/CM | n/a | n/a | 3.4690 | 13.0700 | 14.4295 | n/a | n/a | n/a | n/a | n/a | n/a | |
| Thermal Conductivity | KCAL/HR-M-C | n/a | n/a | 0.08817 | 0.14867 | 0.16216 | n/a | n/a | n/a | n/a | n/a | n/a | |
| Viscosity | CP | n/a | n/a | 0.04231 | 0.12628 | 0.15031 | n/a | n/a | n/a | n/a | n/a | n/a | |
Composite Cooling Curve of top cold aluminum heat exchanger with no liquid slippage
I have made my own model for this purpose.
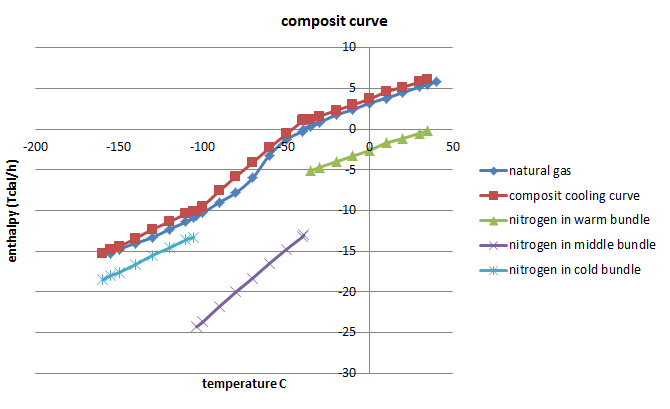
Compsit curve
Comparison with Carnot Efficiency![]()
Carnot efficiency is defined as
h=W/Qc=(Qh-Qc)/Qc=Qh/Qc-1=Th/Tc-1
When condensing curve is assumed straight line from ambient
temperature of 40°C to LNG temperature of -160°C and heat sink
temperature is 40°C, integral of Carnot efficiency with
incremental temperature
of 10°C\ is 0.525.
Actual liquefaction enthalpy change Qc=21,136,000kcal/h, and actual Actual work required W=52,472kWh (45,147000kcal/h).
W/Qc=2.14
This means that actual COP is 4.07 times of Carnot
efficiency.
Acknowledgment
Author is grateful to Invensys Systems Japan, Inc. for letting author use PRO/II v.9.
August 24, 2011
Rev. September 10, 2012