
PRO/II Process Simulation
Natural Gas Liquefaction
by
Mixed Refrigerant (MR) Cycle in Brazed Aluminum Exchangers (Distillation Effect)
by Greenwood
![]()
 |
PRO/II Process SimulationNatural Gas LiquefactionbyMixed Refrigerant (MR) Cycle in Brazed Aluminum Exchangers (Distillation Effect)by Greenwood |
|
Five different liquefaction cycles are used for the base load LNG plants as shown in the following table. But there are only three types of heat exchangers available for selection. Namely spiral wound, brazed aluminum and shell & tube type. Shell & tube type was replaced by brazed aluminum now. For pure refrigerant cycle, brazed aluminum heat exchangers are used. And most of the cycles using mixed refrigerant (MR) use spiral wound heat exchangers. Very few uses brazed aluminum heat exchangers for mixed refrigerant services.
Many people think that spiral wound heat exchangers is easy to make it larger and could fabricate every thing into a single equipment. Although it is costly, but it can reduce construction cost. The same principle is applied for brazed aluminum heat exchanger. They could be assembled in a cold box in a fabrication shop. But big advantage is their low cost.
| Process | Number of Train | Capacity | Heat Exchanger | Specific Power |
| million t/y | kW/(ton/day) | |||
| Cascade cycle | 10 | 25.88 | brazed alumi. | 14.1 |
| Single Mixed Refrigerant | 8 | 9.12 | brazed alumi. | 14.5 |
| Single Mixed Refrigerant | 4 | 2.56 | spiral wound | 14.5 |
| Propane pre-cooled Mixed Refrigerant | 67 | 161.56 | spiral wound | 12.2 |
| Propane, MR, Nitrogen Hybrid or Cascade | 3 | 19.60 | spiral wound | 12.0 |
| Dual Mixed Refrigerant | 4 | 19.80 | spiral wound | 12.5 |
| World Total | 96 | 238.52 | - | - |
Type of world’s base load LNG plant (specific power by R.K.Nagagelvoot et.al)
Regardless the services, all exchangers are installed vertically. Horizontal installation is avoided because it stops thermo-siphon circulation of pure refrigerant and cause vapor liquid mal-distribution of MR.
This is why all exchanger are installed vertically. There would be no further discussions necessary for pure refrigerant services. But for MR, still many question will be raise. Those are: while spiral wound heat exchanger put cold end at the top, brazed aluminum heat exchanger put cold end at the bottom.
Why? Is this the right decision?
You can consider 4 different configurations for spiral wound heat exchanger and 2 configurations for brazed aluminum exchanger as listed below.
| spiral wound | brazed aluminum | |
| top cold | shell side evaporation | top cold |
| tube side evaporation | ||
| bottom cold | shell side evaporation | bottom cold |
| tube side evaporation | ||
Heat exchanger configuration
MR assumes that vapor and liquid flows simultaneously. Keeping such requirements in mind, designer has to select the best configuration. So far, historically, colored combination were selected. Lets look more closely. To make it simple, I took simple MR cycle for the comparison purposes of the selection of type and flow directions of heat exchanger.
Top cold spiral wound heat exchanger
Downward evaporation of low pressure (LP) MR in shell side tends to shift evaporation temperature down by dripping liquid faster than vapor flow. This means that there is no risk of lower heat transfer performance. Condensation of natural gas and high pressure (HP) MR in spiral wound tube does not cause major back flow of liquid by gravity.
Top cold spiral wound heat exchanger
Additionally, downward evaporation in shell side has two advantages. Firstly, you can keep relatively slower velocity, which can minimize pressure loss and avoid evaporation temperature rise. Secondly, liquid head does not hamper evaporation. This is why majority of the MR cycle adopts spiral wound heat exchangers with top cold configuration.
Disadvantage of spiral wound heat exchanger are high cost, mal distribution of liquid over spiral coil bundle, tube failure due to flow induced vibration etc.
Downward evaporation of low pressure (LP) MR in tube side will increase pressure drop unless the tubes are bell or horn shaped. Therefore, it is is not considered as viable options.
Bottom cold spiral wound heat exchanger
In the case of bottom cold design for spiral wound heat exchanger, evaporation of LPMR in shell side result in pool boiling and it is impossible to make simultaneous gas and liquid flow for establishing smoothly inclined cooling curve. Instead, temperature in the pool will be homogenizes by back mixing.
Bottom cold spiral wound heat exchanger
Evaporation of LPMR in tube side might result in excessive pressure drop unless the tubes are bell or horn shaped.
Top cold aluminum heat exchanger
Even though various types of fins are used, basically, flow channels between plate of brazed aluminum runs straight vertically. When flow velocities are low, liquid flowing upward in this channels tend to drop by gravity and temperature profile tends to shift from originally intended curve and affect performances.
In the case of cold top design, condensing natural gas and HPMR becomes up ward flow. Unless you keep minimum velocity in the top cold section, lower velocities could not sustain liquid and lighter fraction liquid flow backs entire length and shift condensing temperature to lower side and cause pinch point. Therefore, this is not a viable configuration.
Top cold aluminum heat exchanger
Bottom cold aluminum heat exchanger
In the case of cold bottom design, evaporating LPMR flows upward. Unless you keep velocity of upward flow in lower sections more than minimum velocity so as the shear forces prevent down flow of liquid by gravity, distillation effect may attack you. By properly selecting size and type of fins, designer may be able to select single core design for anticipated operating range.
If the designer fails to do so, liquid is pulled back by gravity and evaporation temperature shift to warmer side and temperature difference diminishes. You can avoid pinch point by adding more nitrogen into MR. But you will loose production capacity.
Bottom cold aluminum heat exchanger
When you find higher pressures drop in a single core design and end up in increased power consumption of compressor. You can split heat exchanger into two separate core having different cross sectional area. You can put smaller cross sectional exchanger at cold end and bigger cross sectional one at warm end.
Also in downward condensing side, liquid droplets drip faster than vapor velocity and condensing temperature shift colder side. As a result, temperature difference necessary for heat transfer become smaller and you might end up in poor performance of liquefaction capability.
Another weakness of brazed aluminum heat exchanger is vulnerability in low load operation. In the worst case, heat exchanger would be in pinch point.
The Purpose of simulation
Brazed aluminum heat exchanger is sensitive to fluid velocities. Therefore, it is necessary to investigate an effect of liquid slippage on evaporating and condensing temperature of each stream. PRO/II was used for this objectives. For study purpose, simple MR cycle was selected as an example.
Feed Gas Condition
Total Feed gas 6,000kgmol/h (roughly 100ton/h)
Composition:
|
Component |
mol % |
| Nitrogen | 1 |
| Methane | 93 |
| Ethane | 3 |
| Propane | 2 |
| Butane | 1 |
Feed pressure: 60 Bar G
Feed temperature: 40oC
Simulation Model
The exchanger was split into 2 sections for assuring intermediate temperatures differences. Namely cold and warm core. HPMR temperature core inlet, mid point and outlet were taken at40, -60 and -155 oC, respectively.
Temperature approach between LPMR and HPMR inlet, mid point and outlet were taken 10.5oC and JT temperature, respectively.
Pressure drop of each heat exchanger was taken as 0.5Bar.
Heat loss of exchanger was taken as 3%.
To avoid convergence calculation, MR stream was cut at LPMR exchanger inlet.
MR flow rate, MR composition and pressure of HPMR (evaporating) were adjusted to fit temperature approach between LPMR and LNG at mid point and outlet.
PRO/II' function of LNG heat exchanger is to make heat balance only. When zone analysis is requested for each LNG exchanger, and data review window in output pull down menu is opened, internal temperature difference such as zone mita and mean temperature difference could be viewed after each trial run.
PRO/II model
Calculation Results
MR flow rate: 19,000kgmol/h
Pressure of HPMR at exchanger inlet: 49.5BarG
Pressure of LPMR at exchanger inlet: 3 BarG
Temperature: 40oC
MR Composition:
|
Component |
mol % |
| Nitrogen | 12 |
| Methane | 27 |
| Ethane | 26 |
| Propane | 20 |
| Butane | 15 |
This is not a optimum composition. You can find a better set of combinations as there are unlimited combination to achieve good match of composite cooling curve. Lowest temperature is below freezing point of butane (-138.3oC), but butane stays as liquid dissolved in other MR. Pentane could not be used, because it does not dissolve in MR at low temperature.
MR Compressor Adiabatic efficiency: 80%
1st. stage MR compressor: suction volume 155,602m3/h, power consumption 20,205kW
2nd. stage MR compressor: suction volume 28,638m3/h, power consumption: 19,542kW
Total Power consumption: 39,747kW
Total liquid mol fraction after flash: 0.9344
6.56mol % of flash gas is compressed and used as dryer regeneration gas and then plant fuel to drive compressors.
LNG products quantity: 98.6ton/h (790,000ton/y)
Power consumption per ton of LNG: 403kWh/ton LNG or 16.8kW/(tonLNG/day). This means, that further optimization is required.
Plant fuel for power generation: 87.2kg (When power cycle efficiency: 30%, heat of combustion of methane: 890kJ/mol, MW: 16.04, J=Ws )
Overall efficiency: 91.3%
Stream properties
Following table is an out put of PRO/II.
|
Stream |
Name |
S1 |
S2 |
S3 |
S4 |
S5 |
S6 |
S7 |
S8 |
S9 |
S10 |
S12 |
|
|
Description |
LNG in |
LNG mid |
LNG out |
LNG flash |
HPMR in |
HPMR mid |
HPMR out |
LPMR in |
LPMR mid |
LPMR out |
C2 suction |
||
|
Phase |
Vapor |
Mixed |
Liquid |
Mixed |
Mixed |
Mixed |
Liquid |
Mixed |
Mixed |
Vapor |
Vapor |
||
|
Total Stream Properties |
|||||||||||||
|
Rate |
KG-MOL/HR |
6,000 |
6,000 |
6,000 |
6,000 |
19,000 |
19,000 |
19,000 |
19,000 |
19,000 |
19,000 |
19,000 |
|
|
KG/HR |
105,391 |
105,391 |
105,391 |
105,391 |
627,933 |
627,933 |
627,933 |
627,933 |
627,933 |
627,933 |
627,933 |
||
|
Temperature |
C |
40.000 |
-59.247 |
-155.275 |
-161.656 |
40.000 |
-60.000 |
-155.000 |
-157.831 |
-65.000 |
30.000 |
40.000 |
|
|
Pressure |
BAR(GA) |
60.000 |
59.500 |
59.000 |
0.000 |
49.500 |
49.000 |
48.500 |
3.000 |
2.500 |
2.000 |
14.500 |
|
|
Molecular Weight |
17.565 |
17.565 |
17.565 |
17.565 |
33.049 |
33.049 |
33.049 |
33.049 |
33.049 |
33.049 |
33.049 |
||
|
Enthalpy |
MM KCAL/HR |
5.832 |
-2.841 |
-15.304 |
-15.304 |
30.048 |
-23.510 |
-58.282 |
-58.282 |
-9.630 |
54.468 |
53.926 |
|
|
Total Liquid Fraction |
0.0000 |
0.1057 |
1.0000 |
0.9344 |
0.3487 |
0.8808 |
1.0000 |
0.8953 |
0.4698 |
0.0000 |
0.0000 |
||
|
Vapor Phase Properties |
|||||||||||||
|
Rate |
KG-MOL/HR |
6,000 |
5,366 |
n/a |
394 |
12,375 |
2,264 |
n/a |
1,989 |
10,073 |
19,000 |
19,000 |
|
|
KG/HR |
105,391 |
91,184 |
n/a |
6,792 |
355,119 |
52,473 |
n/a |
52,636 |
236,007 |
627,933 |
627,933 |
||
|
M3/HR |
2,322 |
837 |
n/a |
3,494 |
4,968 |
656 |
n/a |
4,462 |
48,157 |
155,602 |
28,639 |
||
|
Molecular Weight |
17.565 |
16.994 |
17.565 |
17.256 |
28.696 |
23.175 |
n/a |
26.464 |
23.429 |
33.049 |
33.049 |
||
|
Density |
KG/M3 |
45.388 |
108.944 |
n/a |
1.944 |
71.483 |
80.004 |
n/a |
11.797 |
4.901 |
4.036 |
21.926 |
|
|
Thermal Conductivity |
KCAL/HR-M-C |
0.03011 |
0.01928 |
n/a |
0.01070 |
0.02293 |
0.01731 |
n/a |
0.00970 |
0.01527 |
0.02022 |
0.02125 |
|
|
Viscosity |
CP |
0.01151 |
0.00830 |
n/a |
0.00479 |
0.01138 |
0.01123 |
n/a |
0.00763 |
0.00886 |
0.01017 |
0.01047 |
|
|
Liquid Phase Properties |
|||||||||||||
|
Rate |
KG-MOL/HR |
n/a |
634 |
6,000 |
5,606 |
6,625 |
16,736 |
19,000 |
17,011 |
8,927 |
n/a |
n/a |
|
|
KG/HR |
n/a |
14,207 |
105,391 |
98,599 |
272,813 |
575,460 |
627,933 |
575,297 |
391,925 |
n/a |
n/a |
||
|
K*M3/HR |
n/a |
0.030 |
0.180 |
0.167 |
0.604 |
0.848 |
0.680 |
0.715 |
0.655 |
n/a |
n/a |
||
|
Molecular Weight |
n/a |
22.393 |
17.565 |
17.587 |
41.181 |
34.385 |
33.049 |
33.819 |
43.905 |
n/a |
n/a |
||
|
Density |
KG/K*M3 |
n/a |
471,082 |
584,571 |
591,589 |
452,020 |
678,444 |
922,933 |
804,991 |
598,637 |
n/a |
n/a |
|
|
Surface Tension |
DYNE/CM |
n/a |
3.8879 |
13.0700 |
14.4296 |
4.6802 |
11.1666 |
22.0118 |
24.7818 |
17.7027 |
n/a |
n/a |
|
|
Thermal Conductivity |
KCAL/HR-M-C |
n/a |
0.09089 |
0.14867 |
0.16216 |
0.07425 |
0.10159 |
0.12804 |
0.15962 |
0.12316 |
n/a |
n/a |
|
|
Viscosity |
CP |
n/a |
0.02841 |
0.12628 |
0.15031 |
0.05547 |
0.10718 |
0.62504 |
0.83975 |
0.24487 |
n/a |
n/a |
|
Composite Cooling Curve of top cold aluminum heat exchanger with no liquid slippage
Although, PRO/II has built in cooling curve drawing capability, I have made my own model for this purpose.
For upward evaporation of LPMR, multiple flash model was made as left hand side of follow drawings.
For down ward condensing of HPMR and LNG, multiple flash model was made as right hand side of follow drawings.
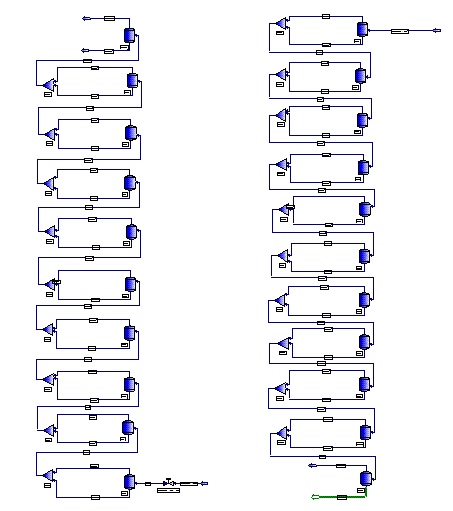
LPMR, multiple flash model (left) and HPMR and LNG, multiple flash model (right)
For making composite curve, you can not add up temperature. You can only add up enthalpy of the same temperature. Therefore, fixed temperature were specified for each flash drum and output duty were added to make composite curve.
Output duty at each fixed temperature were potted by Excel. It looks like following graph. Discrepancy of enthalpy between HPMR inlet and LPMR outlet corresponds to heat loss of 3%.
Composite curve with no slip of liquid
Temperature difference between LPMR and composite of HPMR+LNG is shown in the following graph.
Temperature difference were calculated by following equation.
Dti=DHi (ti-ti+1)/(Hi-Hi+1)LPMR
Temperature difference with no slip of liquid
Smaller temperature difference in low temperature increase efficiency. But still larger temperature difference has to be improved. Air products first tried to do it by multi stage MR. Then they invented propane pre-cooled MR, Recently, Shell and Linde developed dual MR to minimize temperature difference in -50 to 30oC range. They all used brazed aluminum heat exchanger.
Pressure profile in each stream are also made by Excel using output from PRO/II. Those are gas and liquid volumetric flow and specific gravity of liquid. In calculating liquid static head, heat exchanger length of 8m was assumed.
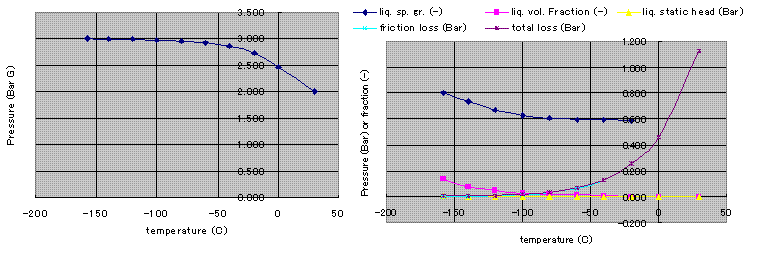
LPMR Pressure profile, liquid specific gravity, liquid volumetric fraction, liquid static head, friction loss
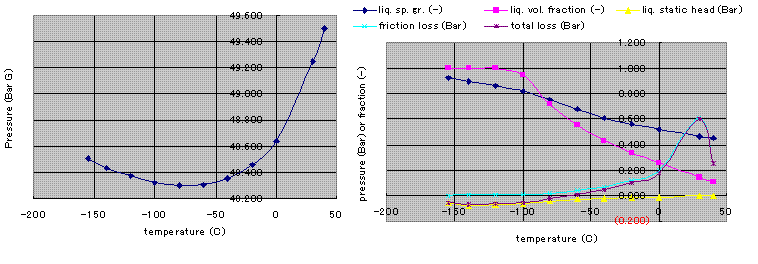
HPMR Pressure profile, liquid specific gravity, liquid volumetric fraction, liquid static head, friction loss
LNG Pressure profile, liquid specific gravity, liquid volumetric fraction, liquid static head, friction loss
Composite Cooling Curve of top cold aluminum heat exchanger with distillation and vapor slip
As previously explained, reflux flow is anticipated
when inlet velocity is low. Also vapor may pass through liquid without
achieving equilibrium with liquid.
For the purpose of investigating effect of distillation in upward
evaporation of LPMR, distillation model was made as left hand side of
follow drawings. Vapor passing model was also made as right hand side
of following drawings. Both would be caused by gravity.
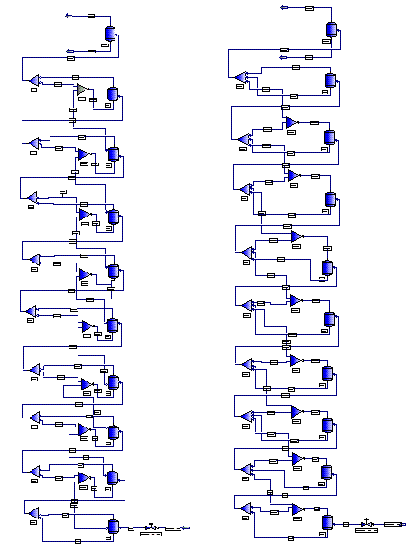
LPMR, distillation model (left) and vapor slip model (right)
New composite curve was drawn after reflecting distillation effect and vapor passing as follows.
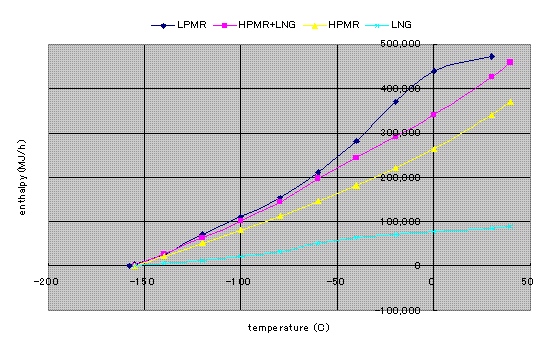
Composite curve with distillation and vapor passing
You can note that temperature difference become negative at the temperature around -140oC. This is a pinch point.
Temperature difference with distillation and vapor passing
It was assumed that maximum reflux rate is 18% of liquid rate and diminish gradually at higher velocities as shown in following chart.
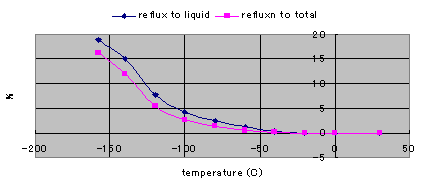
Reflux rate
Temperature rise by reflux
I have assumed that maximum vapor passing rate at the bottom is 50% and diminishes at higher velocities.
Vapor passing rate

Temperature rise by vapor passing
Fluid mechanics and Flow regime of 2 phase flow
When you try to use brazed aluminum heat exchanger, you have to check fluid mechanics using similar analytical approach as presented in Power Generation from LNG Cold.
But in the case of natural gas liquefaction process, it is more easy. Because cool down operation by LNG is not required during start up. And cool down operation is more mildly achieved by MR circulation. JT- valve slowly cools down the system. And there is no upward condensation in cold bottom design of natural gas liquefaction process.
There are many hand book on design. One of them is "Compact Heat Exchangers : Selection, Design, and Operation" by Hesselgreaves, John E., Elsevier Science.
Engineering company and equipment vendor are member of organization to develop thermal and fluid dynamic design programs.
Comparison with Carnot Efficiency![]()
Carnot efficiency is defined as
h=W/Qc=(Qh-Qc)/Qc=Qh/Qc-1=Th/Tc-1
When condensing curve is assumed straight line from ambient
temperature of 40°C to LNG temperature of -160°C and heat sink
temperature is 40°C, integral of Carnot efficiency with
incremental temperature
of 10°C is 0.525.
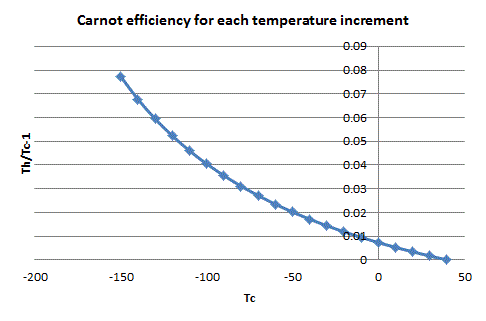
Actual liquefaction enthalpy change Qc=21,136,000kcal/h, and actual Actual work required W=39,747kW (34,199000kcal/h).
W/Qc=1.62
This means that actual COP is 2.95 times of Carnot
efficiency.
Acknowledgment
Author is grateful to Invensys Systems Japan, Inc. for letting author to use PRO/II.
September 19, 2009
Rev. November 5, 2011