Cost of Various Solar Power
Greenwood
 |
Cost of Various Solar PowerGreenwood |
Performance and cost of various solar power generation system were compared based on the same conditions. Solar emission of EC60904-1 AM1.5 was used as basis of comparing conversion efficiency. The same economic criteria were applied for different systems to make consistency.
Following table shows the results of the study.
| Items | Unit | Solar Cell | Artificial Typhoon | Biomass Power | Windturbine av. 5m/sec | Windturbine av. 6m/sec |
| Solar emission, IEC60904-1 AM1.5 | kW /m2 | 1 | 1 | 1 | - | - |
| Day time | h | 12 | 12 | 12 | - | - |
| Average emission in day time/AM1.5 emission | % | 50 | 50 | 50 | - | - |
| Weather factor etc. | % | 45.5 | 80 | 45.5 | - | - |
| Time averaged emission/AM1.5 emission=(Day time/24)*(Average emission in day time/AM1.5 emission)*(Weather factor etc.) | % | 11.4 | 20 | 11.4 | - | - |
| Annual operation days | d/year | 365 | 333 | 320 | 365 | 365 |
| Nominal power output | kW | 3.3 peak | 200,000 peak | 2,380 constant | 1,500x10 | 1,500x10 |
| Area receiving solar emission | m2 | 31.1 | 19,630,000 | 71,180,000 | - | - |
| AM1.5 emission base Conversion efficiency=(Nominal power output)/(Area receiving solar emission)/(AM1.5 emission) | % | 10.6 | 1.1 | 0.00334 | - | - |
| Time averaged base Conversion efficiency=(Conversion efficiency, AM1.5 emission base)/(Time averaged emission/AM1.5 emission) | % | - | - | 0.0293 | - | - |
| Photo synthetic efficiency of biomes (Time averaged emission base) | % | - | - | 0.105 | - | - |
| Annual power generation per unit area=(AM1.5 emission)*(Time averaged emission/AM1.5 emission)*(Conversion efficiency)*(Annual operation days)*24 | kWh/m2/year | 105.8 |
8.30 |
0.256 | - |
- |
| Annual power generation=(Annual power generation per unit area)*(Area receiving solar emission) | kWh/year | 3,289 |
319,600,000 |
18,280,000 | 29,500,000 | 41,000,000 |
| Number of operators | persons | 0 | 5 | 6 | 3 | 3 |
| Initial Investment | million yen | 2.2 | 56,700 | 732 | 3,300 | 3,300 |
| Initial Investment per unit area | yen/m2 | 70,740 | 2,888 |
10.3 | - |
- |
| Annual Revenue/Initial Investment | % | 11.18 | 11.18 | 14.08 | 11.18 | 11.18 |
| Annual Revenue | million yen/year | 0.244 | 6,339 | 103 | 369 | 369 |
| Labor cost (6million yen/year/person) | million yen/year | 0 | 30 | 36 | 18 | 18 |
| Land lease | million yen/year | 0 | 0 | 30 | 0 | 0 |
| Felling, skidding, chipping cost | million yen/year | 0 | 0 | 59 | 0 | 0 |
| Chip forwarding cost | million yen/year | 0 | 0 | 27 | 0 | 0 |
| Lube oil and consumables | million yen/year | 0 | 0 | 6 | 0 | 0 |
| Annual cash flow | million yen/year | 0.244 | 6,369 | 260 | 387 | 387 |
| Power cost | yen/kWh | 74 | 19.9 | 14.2 | 13.1 | 9.4 |
| Reduction of CO2 emission in a year | t/year | 8 | 750,000 | 43 | 69,000 | 96,000 |
Solar cell initial investment in 2004 is 506yen/W.
Reverse engineering of Solar Mission Technologies tells that the technology is feasible technically and economically.

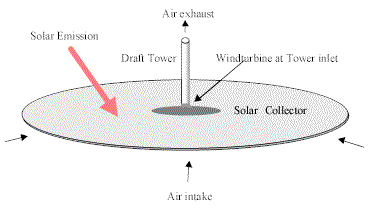
Power Generation by Artificial Typhoon
Power cost of hybrid system between Solar Cell and Solar Draft Power Generation would be 71 yen/kWh.
Biomass power generation use hard wood derived chips as fuel. Forest machinery like Feller Buncher, Grapple Skidder and Chipper would be used for lowering cost of harvesting. For steep terrain, additional cost of forest machinery is only 0.4yen/kWh.
Windturbine assumed utilization of 1,500kW turbine having hub height of 68m. Initial investment is 220,000yen/kW. Two cases for average wind velocity of 5m/sec and 6m/sec were presented here.
Power generation cot of commercial plant officially announced by Association of Power Generation Companies in December 2003 are as follows.
| Items | Unit | Figures |
| Nuclear Power Cost including cost of demolishing and house keeping in safe place of used plant and fuel | yen/kWh | 5.6 |
| Coal fired | yen/kWh | 5.9 |
| Natural Gas fired | yen/kWh | 6.3 |
| Oil fired | yen/kWh | 10.9 |
| Hydro | yen/kWh | 11 |
Nuclear cost does not include cost for long transmission line, load change etc.
Large consumer pays 12yen/kWh and small consumer pays 24yen/kWh. Balance is transmission cost.
February 13, 2004
Rev. April 19, 2008