|
|
Accuracy of Fourier Transform |
|
Fourier transform is used as an analyzing
method for fluctuation. Fourier transform is the algorithm that transforms any wave into
combination of sine and cosine waves. However, it does not mean that a wave is
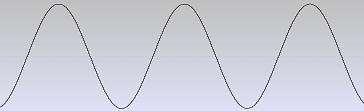
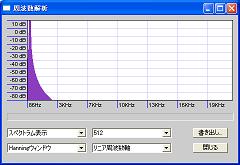
precisely resolved into each frequency. For example, I have prepared a WAV file
including only a sine wave such as the bottom figure. |
 |
|
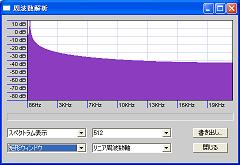
Bottom left figure is the result by using the
analyzing software. |
| Result by analyzing software |
Ideal result |
 |
 |
|
|
Regarding the result by analyzing software, the part where the
mountain in the vicinity of the left end has risen is a frequency of the sine
wave. If Fourier transform were able to resolve precisely, only the part of
frequency of the sine wave would rise and the rest would be zero like the above
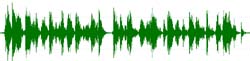
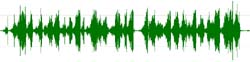
figure of ideal result. Bottom figures are the result of analyzing the same WAV
file by Audacity. Bottom left
figure is displayed by the rectangular window mode and you can see that the
graph is similar to the above figure on the left. Bottom right figure is
displayed by the [Hanning] widow mode. Although the shape of the graph is
different from the ideal result, the part distant from the frequency of sine
wave indicates zero. I could not find the explanation of "Hanning"
in the help of
Audacity, but it seems that "Hanning"
is a name of filter and is used for revising the result. |
  |
|
|
|
|
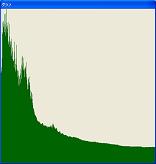
Problems with Sample Number |
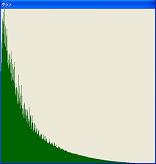
As for the same WAV data, when the number of samples given to the
calculation is changed for the
Fourier transform, the data that have
more sample numbers might be displayed in the shape that is close to "1/f
Fluctuation". This is understandable, but on the contrary, there can be some
cases that the data that have less sample numbers might be displayed in the
shape that is close to "1/f Fluctuation".
(Following figures are not logarithmic graphs, they are the
graphs in normal form.)
Javanese Court Gamelan Ketawang Puspåwårnå
(Sample Number 2048) |
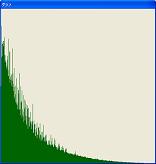
Javanese Court Gamelan
Ketawang Puspåwårnå
(Sample Number 8192) |
 |
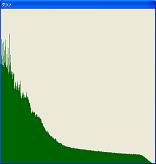 |
Bulgarian Voice
夜の集会
(Sample Number 2048) |
Bulgarian Voice
夜の集会
(Sample Number 8192) |
|
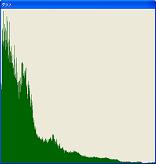 |
Chopin Etude
(Sample Number 2048) |
Chopin Etude
(Sample Number 8192) |
 |
 |
|
|
|
|
|
Does Fluctuation Reflect the Good and Bad
of Music? |
|
It is difficult for us to judge the good and bad of the music
from just looking the graph of frequency component and its shape. The graph of
frequency component indicates no more than degree of fluctuation. For instance,
If you compare the result of analyzing frequency component of a certain music
and the result of analyzing the frequency component of the same music when
reversely played, you will get the same result. If fluctuation is something that
grasps the good and bad of the music, every music should be ear-pleasing and
relaxing regardless of playing reversely. But it is clear that fluctuation does
not have such a role. |
|
|
|
|
|