|
In the fluctuation analysis, you will analyze by the graph
that shows the result of Fourier transformation at each frequency. The
horizontal line indicates the frequencies while the vertical line indicates the
strength. Both axis take logarithm, and the graph will be double logarithmic
plot. |
|
1/f Fluctuation means that when you perform Fourier transform,
resolved components of each frequency gets bigger in proportion to the
reciprocal number of the frequency. In other words, "1/f " is a reciprocal
number of frequency. |
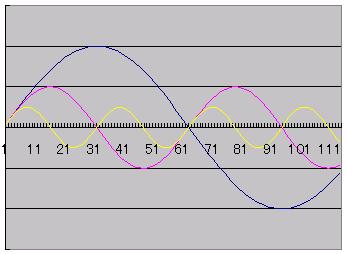
To put it simple, let us look into the three waves and their
synthesized wave.
You can see three waves in the figure below. The bigger the cycle of the wave
is, the stronger the wave becomes. |
 |
|
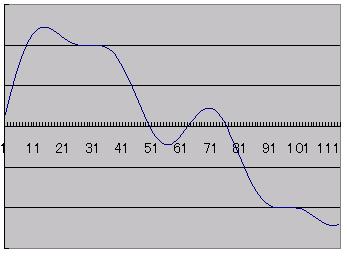
If you synthesize the three waves above, you will see the wave
below. To put it the other way around, if you resolve the following wave by the
Fourier's method, you will get the three waves above. |
 |
|
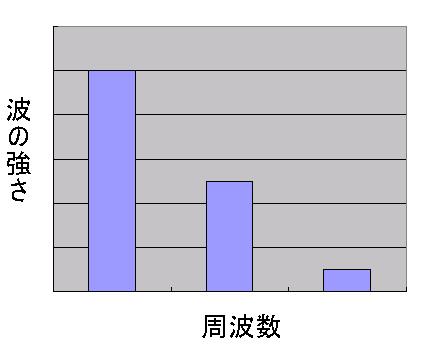
The chart below is a double logarithmic plot. The horizontal line
indicates frequency, vertical line indicates wave strength, and both axis take
logarithm. |
 |
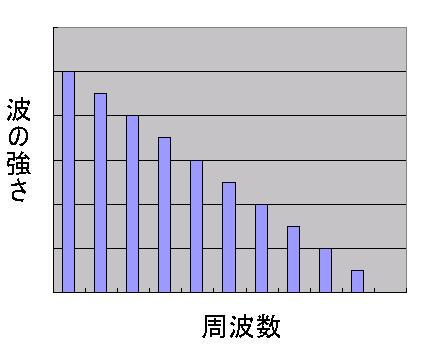
When you don not limit to three waves like above example,
following chart will be the one that you will normally see.
You can see that wave of longer cycle gets higher amplitude while the wave of
shorter cycle gets lower amplitude. |
 |
|
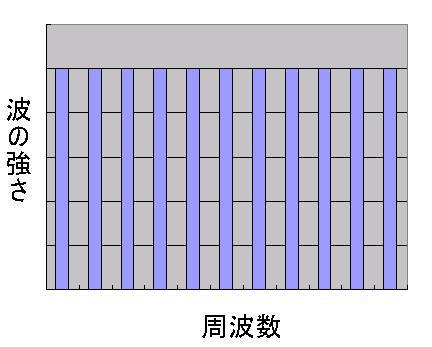
On the other hand, the following chart indicates the result when
you transform random numbers that is equally distributed and has no repetition. |
 |