
| |
Fukushima Meltdown |
Magnitude 9 in March 11, 2011
Japan Earthquake: before and after
Decay Heat
|
heat (kW) |
day after scrum |
decay/fission ratio (%) |
cumulative decay/fission (%) |
|
|
power output |
1,100,000 |
- |
- |
- |
|
fission heat (38%) |
2,894,737 |
- |
100 |
- |
|
decay heat |
225,000 |
0 |
7.7727 |
0.000 |
|
decay heat |
17,000 |
1 |
0.5873 |
8.360 |
|
decay heat |
10,000 |
5 |
0.3455 |
9.742 |
|
decay heat |
7,500 |
10 |
0.2591 |
11.037 |
|
decay heat |
4,060 |
30 |
0.1403 |
13.248 |
|
decay heat |
1,740 |
90 |
0.0601 |
16.855 |
|
decay heat |
660 |
365 |
0.0228 |
23.125 |
|
decay heat |
300 |
730 |
0.0104 |
26.907 |
|
decay heat |
204 |
1,095 |
0.0070 |
28.269 |
|
decay heat |
180 |
1,460 |
0.0062 |
31.447 |
Decay heat
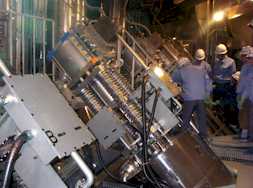
Flow Scheme of BWR
normal operation of GE Mark-I reactor
Fukushima was not destroyed by earth quake. G-force was below design strength. The cause of loss of power was evidently caused by Tsunami. All electrical circuit suffered short circuit and never came back.
No.1 unit was equipped with isolation condenser. It worked excellently. But operator stopped it after 8 min operation. Because it cooled down so quickly. But operator never switched it on because all operator left the room because of station black out. The core started generation hydrogen after 4hours and completely melts down after 6 hours.
Pressure of primary containment reached 2 times of design pressure and containment started leaking. Accumulated hydrogen blew up upper portion of the reactor building.
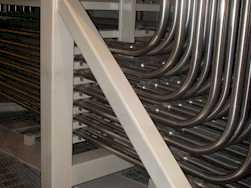
isolation condenser and isolation cooler turbine
No.2&3 unit were equipped with isolation cooler turbine. It also worked but when battery run out. The loss of battery power to control circuit stopped the turbine.Pressure of primary containment reached 2 times of design pressure and containment started leaking. Accumulated hydrogen blew up upper portion of the reactor building.
hydrogen gas leak and vent
Temprary Water Injection
Sea water was injected by fire engine.
Salt Deposition in Reactor
GE designer Richard T. Lahey Jr. pointed out this problem
Failure of Pressure Containment Vessel and Hydrogen Explosion of Reactor Building
Zr + H2O = ZrO2 + H2
hydrogen explosion and sea water injection by fire engine
Heat and Water Balance after Scrum
Those figures are Greenwood' estimate.
|
Unit No |
1 |
2 |
3 |
4 |
|
|
power output |
kW |
460,000 |
784,000 |
784,000 |
784,000 |
|
fission heat (assumed thermal efficiency of 38%) |
kcal/h |
1,040,810,526 |
1,773,903,158 |
1,773,903,158 |
1,773,903,158 |
|
cumulative decay/fission ratio of reactor fuel over 10days |
% |
11.037 |
11.037 |
12.141 |
11.037 |
|
cumulative decay/fission ratio of reactor fuel over 30days |
% |
13.248 |
13.248 |
14.573 |
14.573 |
|
cumulative fission heat of reactor fuel over 10days |
kcal |
114,874,258 |
195,785,692 |
215,364,261 |
195,785,692 |
|
cumulative fission heat of reactor fuel over 30days |
kcal |
137,886,579 |
235,006,690 |
258,507,359 |
258,507,359 |
|
design pressure of containment |
kPaG |
430 |
430 |
430 |
430 |
|
max. permissible temperature of water |
C |
145 |
145 |
145 |
145 |
|
sea water temperature |
C |
10 |
10 |
10 |
10 |
|
water enthalpy change between sea and containment |
kcal/kg |
135 |
135 |
135 |
135 |
|
minimum water required for cooling over 10 days |
ton |
851 |
1,450 |
1,595 |
1,450 |
|
minimum water required for cooling reactor over 30 days |
ton |
1,021 |
1,741 |
1,915 |
1,915 |
|
minimum salt deposited inside reactor over 10 days (3.5%) |
ton |
29.8 |
50.8 |
55.8 |
0.0 |
|
actually injected water until April 2 (over 22days) |
ton |
5,700 |
9,300 |
9,000 |
0 |
|
assumed reactor inside diameter |
m |
4.5 |
5.3 |
5.3 |
5.3 |
|
reactor volume (assumed length of 15m) |
cu.m |
238.6 |
330.9 |
330.9 |
330.9 |
|
theoretical water injection rate over 10 days |
ton/h |
4 |
6 |
7 |
6 |
|
actual sea water rate |
ton/h |
2 to 18 |
NA |
NA |
NA |
|
inside diameter of suppression chamber tube |
m |
6.0 |
6.5 |
6.5 |
6.5 |
|
diameter of torus |
m |
27.0 |
28.5 |
28.5 |
28.5 |
|
volume of suppression chamber |
ton |
2,398 |
2,971 |
2,971 |
2,971 |
|
diameter of dry well upper portion (assumed length of 15m) |
m |
9.0 |
9.6 |
9.6 |
9.6 |
|
diameter of dry well sphere |
m |
14 |
17.7 |
17.7 |
17.7 |
|
volume of dry well minus reactor volume |
ton |
2,152 |
3,658 |
3,658 |
3,658 |
|
total volume of dry well + suppression chamber - reactor |
ton |
4,551 |
6,629 |
6,629 |
6,629 |
|
(total volume of dry well + suppression chamber - reactor)/reactor |
- |
19 |
20 |
20 |
20 |
|
reactor thickness |
cm |
16 |
16 |
16 |
16 |
|
containment wall thickness |
cm |
3 |
3 |
3 |
3 |
|
volume of surface condenser (water inside) |
ton |
1,600 (400) |
3,000 (3,000) |
3,000 (3,000) |
3,000 (3,000) |
|
condensed water tank (water inside) |
ton |
2,000 (700) |
2,359 (900) |
2,500 (1500) |
0 |
|
spilled water depth in turbine room |
m |
2.0 |
2.0 |
2.0 |
0.0 |
|
spilled water in reactor house basement |
ton |
3,806 |
4,503 |
4,503 |
4,503 |
|
spilled water in turbine room |
ton |
4,000 |
4,000 |
4,000 |
0 |
|
spilled water in pit |
ton |
3,100 |
6,000 |
4,200 |
? |
|
fuel pool volume of 12m depth |
ton |
1,020 |
1,425 |
1,425 |
1,425 |
|
status of pool gate |
- |
closed |
closed |
damaged |
closed |
|
volume of cover water based on above gate status |
ton |
680 |
950 |
475 |
950 |
|
status of pool gate |
- |
closed |
closed |
damaged |
open |
|
volume of cover water based on above gate status |
ton |
680 |
950 |
475 |
1,900 |
|
number of spent fuel assembly |
- |
292 |
587 |
514 |
1,331 |
|
number of spent fuel lot in pool |
- |
0.5 |
1 |
0.9 |
3 |
|
decay/fission ratio of first year |
% |
0.0114 |
0.0228 |
0.02052 |
0.0601 |
|
decay/fission ratio of 2nd year |
% |
0 |
0 |
0 |
0.0228 |
|
decay/fission ratio of 3rd year |
% |
0 |
0 |
0 |
0.0104 |
|
total decay/fission ratio |
% |
0.0114 |
0.0228 |
0.02052 |
0.0933 |
|
decay heat rate of spent fuel in pool |
kcal/h |
118,652 |
404,450 |
364,005 |
1,655,052 |
|
water enthalpy change between 40C water and 100C steam |
kcal/kg |
598.8 |
598.8 |
598.8 |
598.8 |
|
supplied water to pool of spent fuel until April 2 (over 22days) |
ton |
included in 3 |
0 |
6200 inc.4 &1 |
included in 4 |
|
cumulative evaporation loss of pool water over 10 days |
ton |
48 |
162 |
146 |
663 |
|
time to loose water submergence |
days |
143 |
59 |
33 |
14 |
|
decay heat rate of spent fuel in pool reported by media |
kcal/h |
60,000 |
400,000 |
200,000 |
2,000,000 |
|
reported cumulative evaporation loss of pool water over 10 days |
ton |
24 |
160 |
80 |
802 |
heat and water balance
Historical Operating Condition of RPV
| Reactor No | 1 | 2 | 3 |
| pressure (Mpa)@March 23 | 0.25 | - | - |
| pressure (Mpa)@March 24 | 0.385 | 0.063 | 0.137 |
| pressure (Mpa)@March 25 | 0.31 | - | - |
| temperature (oC) @March 22 | 302 | - | - |
| temperature (oC) @March 23 | 400 | - | - |
| temperature (oC) @March 24 | 182 | 105 | 185 |
| temperature (oC) @March 28 | 320 | - | - |
| temperature (oC) @March 29 | 299 |
170 |
- |
| temperature (oC) @April 2 | 249 | - | - |
historical pressure and temperature
Intended Venting
| unit No | 1 | 2 | 3 |
| March 12, 10:17 | 1 | ||
| March 13, 8:41 | 1 | ||
| March 13, 11:00 | 1 | ||
| March 14, 5:20 | 1 | ||
| March 15, 0:02 | dry vent |
official announced venting
But most of gas were released by leakage from Pressure Containment Vessel.(AERA: Asahi Shimbun Extra Report and Analysis)
|
date |
time |
event |
|
2011/3/11 |
14:46 |
scrum |
|
15:41 |
emergency diesel generator stopped |
|
|
22:00 |
mobile emergency diesel generator mal function |
|
|
2011/3/12 |
2:30 |
pressure of pressure containment vessel (PCV) of reactor-1 reached 840kPa>2times of design pressure |
|
5:30 |
sudden de-pressuring of pressure containment vessel of reactor-1(possible release of radioactive gas) |
|
|
6:30 |
start pumping fresh water into reactor-1 by fire engine |
|
|
15:36 |
explosion of reactor-1building |
|
|
20:20 |
switched to sea water |
|
|
2011/3/13 |
2:44 |
unable to inject sea water into reactor-3 due to high pressure |
|
9:20 |
intended venting radioactive gas from reactor-3 |
|
|
15:29 |
high radioactive density of 1,015mSv/h by unintended gas release from reactor-3 |
|
|
2011/4/14 |
7:44 |
pressure of PCV of reactor-3 reached 460kPa |
|
11:01 |
explosion of reactor-3 building |
|
|
13:25 |
loss of cooling capability of reactor-2 |
|
|
16:34 |
start pumping fresh water into reactor-2 by fire engine |
|
|
21:37 |
high radioactive density of 3,130mSv/h around reactor-2 |
|
|
22:50 |
abnormal high pressure of PCV of reactor-2 |
|
|
2011/3/15 |
1:11 |
high radioactive density by unintended gas release from reactor-2 |
|
6:00 |
explosion of reactor-4 building (possibly by gas from reactor-3 through vent stack duct) |
|
|
6:14 |
explosion of PCV of reactor-2 |
|
|
9:38 |
fire in reactor-4 building |
|
|
2011/3/16 |
5:45 |
fire in reactor-4 building |
|
8:30 |
steam from reactor-3 building |
historical record of event by Magazine "AERA"
record of operating pressure of RPV
record of operating temperature of RPV
record of operating pressure of PCV
You can find current data from State of the reactor pressure container Hukushima primary.
Radiation in Fukushima Power Plant (V; intended vent, U; unintended leak, E;explosion)
Reactor pressure vessel were damaged at bottom penetration of control rod driver and instrument housing and drain.
drain, IC & CRD housing penetration at the bottom of the reactor
Expansion bellow of pressure containment vessel were damaged by over pressure
Path way of radiation material 
containment of BWR
Steam isolation valve |
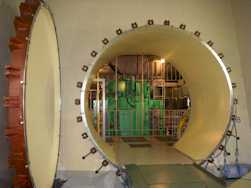
Primary containment access lock |
tube between CRD and control unit |
water circulation and water treatment
|
Fission Products |
half-life |
detected by TEPCO |
FP concentration (wt%) |
|
140barium |
13d |
yes |
trace |
|
133caesium |
stable |
no |
6.79 |
| 134caesium |
2y |
yes |
trace |
|
136caesium |
13d |
yes |
trace |
|
137caesium |
30y |
yes |
6.09 |
|
56cobalt |
77d |
yes |
trace |
|
58cobalt |
71d |
yes |
trace |
|
60cobalt |
5y |
yes |
trace |
|
129iodine |
15.7My |
no |
0.66 |
|
131iodine |
8d |
yes |
2.83 |
|
132iodine |
2h |
yes |
trace |
|
134iodine |
53m |
yes |
trace |
|
135iodine |
6.6h |
no |
6.33 |
|
115indium |
440Gy |
no |
trace |
|
85krypton |
11d |
no |
trace |
|
140lanthanum |
2d |
yes |
trace |
|
99molybdenum |
66h |
yes |
trace |
|
147promethium |
2.6d |
no |
2.27% |
|
106ruthenium |
370d |
yes |
trace |
|
149samarium |
stable |
no |
1.09 |
|
75selenium |
120d |
no |
trace |
|
108silver-m |
418y |
yes |
trace |
|
121Sn |
55y |
no |
trace |
|
90strontium |
29y |
no |
5.75 |
|
90technetium |
211ky |
no |
6.05 |
|
99technetium-m |
6h |
yes |
trace |
|
99technetium |
211ky |
no to yes |
6.05 |
|
129tellurium |
70m |
yes |
trace |
|
129tellurium-m |
34m |
yes |
trace |
|
132tellurium |
3d |
yes |
trace |
|
tritium |
12y |
no |
trace |
|
127xenon |
36d |
no |
trace |
|
88yttrium |
107d |
no |
trace |
|
88zirconium |
83d |
no |
trace |
|
93zirconium |
1.5My |
no |
6.3 |
possible fission products
radiation spectrum
|
Date:March 26 |
Unit-1 |
Unit-2 |
Unit-3 |
|
|
Fission Products |
half-life |
Bq/cc |
Bq/cc |
Bq/cc |
|
74arsecic |
18d |
390 |
||
|
38chlorine |
37min |
1,600,000 |
||
|
140barium |
13d |
490,000 |
19,000 |
|
|
134caesium |
2y |
120,000 |
2,200,000 |
55,000 |
|
136caesium |
13d |
11,000 |
250,000 |
6,500 |
|
137caesium |
30y |
130,000 |
220,000 |
56,000 |
|
131iodine |
8d |
150,000 |
13,000,000 |
320,000 |
|
134iodine |
53min |
|||
|
140lanthanum |
2d |
340 |
190,000 |
3,100 |
|
91yttrium |
59d |
390 |
||
|
Total |
- |
2,012,120 |
16,350,000 |
459,600 |
detected fission products in water
|
Actinide or Truns-uranium |
half-life |
detected by TEPCO |
concentration(wt%) |
|
237neptunium |
2,140,000y |
no |
|
|
238plutonium |
88y |
no to proportional to fuel |
|
|
239plutonium |
24,000y |
no to proportional to fuel |
4%(reactor 2) |
|
240plutonium |
6,500y |
no to proportional to fuel |
|
|
241amerisium |
432y |
no |
|
|
235uranium |
7,000,000y |
no to proportional to fuel |
1%(reactor1&3) |
detected actinide or Truns-uranium
decay of radiation
Areial Photographtaken in March24
Spent fuel pool were OK
Most of spent fuel were not damaged as imagined.
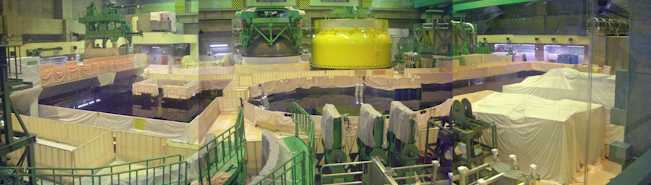
spent fuel pool reactor well and equipment pool (kashiwazaki-4)
Total radioactive material released to atmosphere
total released iodine131 and caesium137 into atmosphere by Atomic Safety Commission of Japan
Chornobyl vs. Fukushima
Chornobyl overlapped over Japan
Total radioactive flowed into environment
|
unit |
Chornobyl |
vented to atmosphere |
contained quantity |
water spilled to sea |
spilled % to Chornobyl |
|
|
radiation contained in 3 reactors @ 3/11 |
tBq |
- |
- |
640,000,000 |
- |
- |
|
radiation contained in 3 reactors @ 4/11 |
tBq |
- |
- |
72,000,000 |
- |
- |
|
radiation contained in pool 1-3 @ 4/11 |
tBq |
- |
- |
14,000,000 |
- |
- |
|
radiation contained in pool 4 @ 4/11 |
tBq |
- |
- |
21,000,000 |
- |
- |
|
iodine |
tBq |
1,800,000 |
150,000 |
6,100,000 |
- |
- |
|
caesium |
tBq |
3,400,000 |
480,000 |
710,000 |
- |
- |
|
caesium+iodine release to atmosphere |
tBq |
5,200,000 |
630,000 |
247,437 |
27,468 |
12.6 |
|
total radiation released to atmospher |
tBq |
11,000,000 |
? |
- |
- |
- |
|
soil radiation evacuation limit |
Bq/sq.m |
555,000 (15Ci/sq.km) |
? |
- |
- |
- |
|
soil radiation of Iidate Village |
Bq/sq.m |
- |
3,260,000 |
- |
- |
- |
|
Namie village radiation @ March 22 |
microSv/h |
- |
90 |
- |
- |
- |
|
Namie village radiation @ March 22 |
microSv/h |
- |
45 |
- |
- |
- |
|
Time to evacuation limit of 50mSv/y |
days |
- |
31 |
- |
- |
- |
total radiation to environment
Radioactive waste water
Officially announced total radiation discharged to sea from Unit-2 is 4,700tBq. Low concentration waste from Unit 5 & 6 and waste treating plant is 150GBq.
|
Unit No. |
unit |
1 |
2 |
3 |
4 |
5 & 6 |
waste treating |
contained radiation |
discharged radiation |
Chornobyl |
|
iodine in reactor from NRC data @3/11 |
tBq |
1,344,000 |
2,378,000 |
2,378,000 |
0 |
0 |
- |
6,100,000 |
- |
- |
|
caesium in reactor from NRC data @3/11 |
tBq |
162,000 |
274,000 |
274,000 |
0 |
0 |
- |
710,000 |
- |
- |
|
iodine+caesium in reactor @3/11 |
tBq |
1,506,000 |
2,652,000 |
2,652,000 |
0 |
0 |
- |
6,810,000 |
- |
- |
|
contained water in reactor basement |
ton |
3,806 |
4,503 |
4,503 |
4,503 |
- |
- |
- |
- |
- |
|
contained water in turbine room |
ton |
4,000 |
4,000 |
4,000 |
0 |
- |
- |
- |
- |
- |
|
contained water in pit |
ton |
3,100 |
6,000 |
4,200 |
- |
- |
- |
- |
- |
- |
|
contained water |
ton |
10,906 |
14,503 |
12,703 |
- |
- |
- |
- |
- |
- |
|
radiation concentration |
MBq/cc |
0.41 |
16.35 |
0.46 |
- |
- |
- |
- |
- |
- |
|
total contained radiation |
4,472 |
237,123 |
5,843 |
- |
- |
- |
247,437 |
- |
- |
|
|
leakage rate |
ton/h |
- |
7 |
- |
- |
- |
- |
- |
- |
- |
|
leakage duration from March 27 |
days |
- |
10 |
- |
- |
- |
- |
- |
- |
- |
|
total radiation of leakage |
tBq |
- |
27,468 |
- |
- |
- |
- |
- |
- |
- |
|
planned discharge to sea |
ton |
- |
- |
- |
- |
1,323 |
9,070 |
- |
- |
- |
|
radiation concentration |
Bq/cc |
- |
- |
- |
- |
1.5to20 |
13.0 |
- |
- |
- |
|
total radiation discharged to sea |
tBq |
0 |
27,468 |
0 |
0 |
0.03 |
0.12 |
0 |
27,468 |
5,200,000 |
fouled water
|
color |
min (microSv/h) |
mav. (microSv/h) |
min. (mSv/y) |
max. (mSv/y) |
|
19 |
91 |
166 |
797 |
|
|
9.5 |
19 |
83 |
166 |
|
|
3.8 |
9.5 |
33 |
83 |
|
|
1.9 |
3.8 |
17 |
33 |
|
|
1 |
1.9 |
9 |
17 |
|
|
1 |
0 |
9 |
Radiation
map by Japanese Government
http://www.zamg.ac.at/pict/aktuell/20110326_fuku_I-131.gif
French Simulation
Radiation level in Yokosuka 250km from Fukushima
nGy/h=0.001mSv/h
Radiation in Yokosuka Naval base
Incinerated ashes of sewage plant showed high radiation. Before detection it was shipped to cement plant. But soon it was stopped. Many similar things were found in various place of eastern Japan.
Operational History of Unit-1
|
date |
time |
event |
|
3/11 |
14:46 |
scrum |
|
15:42 |
emergency diesel generator stopped |
|
|
16:36 |
emergency cooling system unable to inject water |
|
|
3/12 |
1:20 |
pressure of primary containment vessel (PCV) reached 840kPa>2 times of design pressure |
|
5:30 |
sudden de-pressuring of primary containment vessel of reactor-1(possible release of radioactive gas) | |
|
10:17 |
start venting |
|
|
15:36 |
explosion of reactor-1building |
|
|
20:20 |
start pumping sea water and boron through fire fighting line |
|
|
3/23 |
2:33 |
added feed water line for water injection |
|
3/24 |
11:30 |
power to central control room |
|
3/29 |
8:32 |
temporary motor driven water injection |
|
3/31 |
12:00 |
transfer of water from condensate water tank to suppression water tank |
|
13:31 |
start pumping fresh water into reactor-2 by fire engine |
|
|
21:37 |
water pouring to pool |
|
|
4/3 |
13:55 |
transfer of water from surface condenser to condensate water tank |
|
4/6 |
22:30 |
start injection of nitrogen to PCV |
officially announced event for unit-1 on April 8
Operational History of Unit-2
|
date |
time |
event |
|
3/11 |
14:46 |
scrum |
|
15:42 |
emergency diesel generator stopped |
|
|
16:36 |
emergency cooling system unable to inject water |
|
|
3/12 |
1:20 |
pressure of primary containment vessel (PCV) reached 840kPa>2 times of design pressure |
|
3/13 |
10:17 |
start venting |
|
3/14 |
13:25 |
loss of cooling capability |
|
16:34 |
start pumping sea water |
|
|
3/15 |
0:02 |
venting |
|
3/15 |
6:10 |
sound of explosion |
|
3/15 |
6:20 |
damage to supression chamber? |
|
3/20 |
15:15 |
sea water charge to spent fuel pool (40t) |
|
15:46 |
power to power center |
|
|
3/21 |
18:22 |
white smoke |
|
3/22 |
16:07 |
sea water charge to spent fuel pool (18t) |
|
3/29 |
16:45 |
water transfer from condensate water storage tank to supression water surge tank |
|
4/9 |
13:10 |
water transfer from surface condenser to condensate water storage tank |
officially announced event for unit-2 on April 8
Operational History of Unit-13
|
date |
time |
event |
|
3/11 |
14:46 |
scrum |
|
15:42 |
emergency diesel generator stopped |
|
|
3/13 |
5:10 |
emergency cooling system unable to inject water |
|
3/13 |
5:10 |
venting |
|
3/13 |
13:12 |
start pumping sea water and boron |
|
3/14 |
5:20 |
venting |
|
3/14 |
11:01 |
explosion |
|
3/16 |
8:30 |
white smoke |
|
3/17 |
9:48 |
water pouring to pool by helicopter |
|
19:05 |
water jet to pool by police |
|
|
19:35 |
water jet to pool by army |
|
|
3/25 |
18:02 |
swith to fresh water |
officially announced event for unit-3 on April 8
Probabiliy vs. released Radioactive material follows Power Law
Power Law Density Distribution of nuclear accidents
Cost Issue
This accident means grid cost increase of 5.4yen/kWh.
April 5, 2011
Rev. June 28, 2012