 Q-map(a)
ハ
ハ
 Q-map(b)
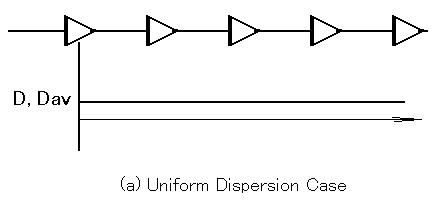
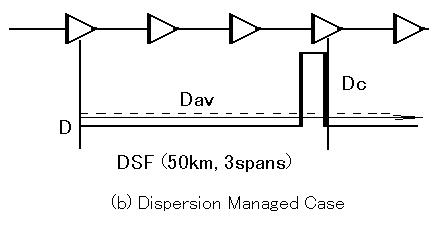
Dispersion management effect on soliton transmission.
These simulation results indicate the importance of dispersion management.
In the dispersion managed case (b), the optimum average dispersion becomes
small,
and soliton interactions are suppressed.
Q-maps indicate the transmissible conditions ( Q > 4, 6, 8, 10, 12 ).
X-axis is average dispersion [ -0.08, +0.32 ps/nm/km ],
and Y-axis is pulse peak power [ +0, +20 dBm ].
10,000 km transmission and every 1,000 km area is
indicated.
Calculated by Kazuhiro Shimoura with Mathematica 3.0.1.
( Aug. 11 1998, all rights reserved )