
PRO/II Process Simulation
Power Generation from LNG Cold
Using Mixed Fluid
by Greenwood
![]()
|
|
PRO/II Process SimulationPower Generation from LNG ColdUsing Mixed Fluidby Greenwood |
|
Long time ago, though it was in 1980s, I have designed and built a plant generating power from LNG cold. The idea was the adoption of reverse cycle of natural gas liquefaction into power cycle. At that time, Rankin cycle using pure propane as working fluid or direct expansion of natural gas by turbo-expander was already planed. But my idea was to to use mixed refrigerant as working fluid.
What I can remember about this plat is that the capacity was 100ton/h and we utilized second hand generator of 6,000kW and turn down to 25% of the design capacity was a high hurdle.
Both in pilot plant and in scaled-up commercial plant, when the plant is operated at low load, liquid slippage in upward flow in brazed aluminum heat exchanger caused distillation effect and changed temperature profile of evaporation or condensation streams. This caused pinch point in a exchanger and the plant couldn't operate further. Visible phenomena was a flat temperature profile along entire length of heat exchanger.
The problem was removed by stopping liquid slippage in upward flow channels by increasing velocity.
The purpose of the process simulation using PRO/II is reconstruction what I have experienced, and gives reader of this article an attention to be taken during design of similar plant using brazed aluminum heat exchanger for mixed refrigerant cycle.
What observed in Pilot plant
During cool down operation of brazed aluminum heat exchanger used for pilot plant of power generation from LNG cold, liquid accumulated in upward LNG evaporation micro channels.
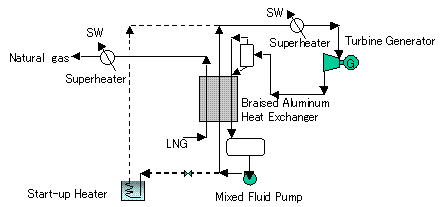
Pilot plant of power generation from LNG cold
This accumulation was caused by low flow rate of LNG during cool down operation. Cool down speed of brazed aluminum heat exchanger is limited for protecting exchanger from thermal shock. Therefore, you have to charge LNG slowly. At low flow rate of LNG, liquid flows back in the exchanger and accumulate at the bottom. As LNG evaporation is once through flow, heavies fraction is continuously added to the accumulated liquid and flooded the evaporator. To over come from this problem, temporary heater was installed to by-pass a part of high pressure mixed refrigerant. By doing so, it was possible to increase LNG flow rate during cool down of the heat exchanger. (LNG 7 Session II Paper 15) For larger size commercial plant, this problem was avoided by serial connection of slim and fat heat exchangers in series.
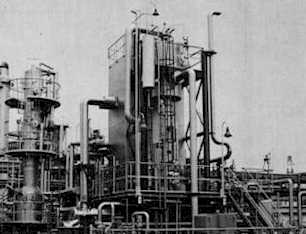
Pilot plant (from LNG handbook LNG-6)
What observed in Commercial Plant
As expander discharge is two phase flow, expander generator has to be installed at the top of cold box. But to avoid expensive foundation, we decided to bend cold box at intermediate point and put it in reverse U shaped. We provided vapor liquid separation drums and separate gas and liquid feed lines for all two phase inlet to the exchangers. Regardless of this provisions, we found liquid reflux in the upward condensation in fat heat exchangers at low load. Consequence is a pinch point in brazed aluminum heat exchanger. To over come this difficulty, two brazed aluminum heat exchangers were demolished out of 6. (Unpublished)
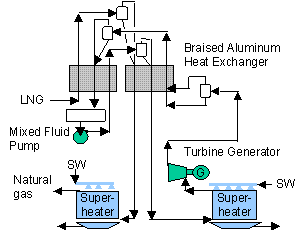
Commercial plant of power generation from LNG cold
LNG Feed Condition
Total Flow: 6,000kgmol/h (roughly 100ton/h)
Composition:
|
Component |
mol % |
| Nitrogen | 1 |
| Methane | 93 |
| Ethane | 3 |
| Propane | 2 |
| Butane | 1 |
Feed pressure: 36 Bar G (trunk line pressure of town gas)
Simulation Model
The exchanger was split into 2 sections for assuring intermediate temperature differences. Namely cold and warm core. LNG temperature at LNG inlet, mid point and outlet were taken at-150, -90 and -30oC, respectively.
Temperature approach between LNG and LPMR at LNG inlet, mid point and were taken 3, 10oC, respectively.
Expander inlet temperature was taken as 20oC. (super heated by open rack type panel heater using sea water)
Expander inlet pressure: 13BarG
Expander outlet pressure was taken as 2 BarG.
Pressure drop of each heat exchanger was taken as 0.5Bar.
Heat loss of exchanger was taken as 3%.
To avoid convergence calculation,MR stream was cut at turbine exhaust. temperature was manually adjusted.
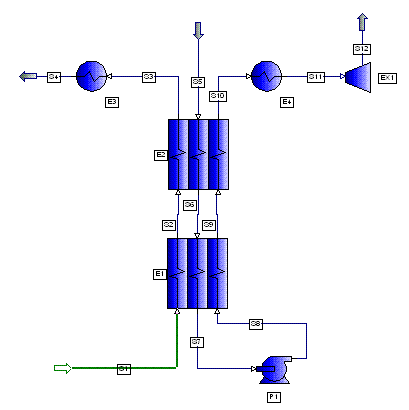
PRO/II model
MR flow rate, MR composition were adjusted to meet HPMR mid point and outlet to around -100 to -90 and -30oC respectively.
PRO/II's function of LNG heat exchanger is to make heat balance only. When zone analysis is requested for each LNG exchanger, and data review window in output pull down menu is opened, internal temperature difference such as zone mita and mean temperature difference could be viewed after each trial run.
In the first trial, I found negative temperature difference in cold core. In the second trial, a set of composition was found to fulfill positive temperature differences for entire temperature range.
Calculation Results
MR flow rate: 5,939kgmol/h
MR Composition:
|
Component |
mol % |
| Methane | 20 |
| Ethane | 42 |
| Propane | 30 |
| Butane | 8 |
Although melting point of butane is -138oC, it does not freeze in lowest temperature of MR circuit as it does dissolve in other lighter components.
Expander Adiabatic efficiency: 80%
Expander power output: 3,887kW
MR pump efficiency : 75%MR pump power consumption: 137kW
Stream properties
Following table is an out put of PRO/II.
|
Stream |
S1 |
S2 |
S3 |
S5 |
S6 |
S7 |
S8 |
S9 |
S10 |
S11 |
S12 |
|
|
LNG in |
LNG mid |
LNG out |
LPMR in |
LPMR mid |
LPMR out |
HPMR in |
HPMR mid |
HPMR out |
EX on |
EX out |
||
|
Liquid |
Liquid |
Vapor |
Mixed |
Mixed |
Liquid |
Liquid |
Liquid |
Mixed |
Mixed |
Mixed |
||
|
Total Stream Properties |
||||||||||||
|
Rate |
KG-MOL/HR |
6,000 |
6,000 |
6,000 |
5,939 |
5,939 |
5,939 |
5,938 |
5,938 |
5,938 |
5,938 |
5,938 |
|
KG/HR |
105,391 |
105,391 |
105,391 |
200,243 |
200,243 |
200,243 |
200,209 |
200,209 |
200,209 |
200,209 |
200,209 |
|
|
Temperature |
C |
-150.000 |
-90.000 |
-30.000 |
-24.187 |
-80.000 |
-147.000 |
-146.717 |
-101.842 |
-29.969 |
20.000 |
-24.187 |
|
Pressure |
BAR(GA) |
36.000 |
35.500 |
35.000 |
2.000 |
1.500 |
1.000 |
14.000 |
13.500 |
13.000 |
12.500 |
2.000 |
|
Molecular Weight |
17.565 |
17.565 |
17.565 |
33.717 |
33.717 |
33.717 |
33.717 |
33.717 |
33.717 |
33.717 |
33.717 |
|
|
Enthalpy |
MM KCAL/HR |
-14.927 |
-8.825 |
2.165 |
14.095 |
-7.436 |
-18.240 |
-18.120 |
-13.094 |
-1.907 |
17.434 |
14.093 |
|
Total Liquid Fraction |
1.0000 |
1.0000 |
0.0000 |
0.0416 |
0.7483 |
1.0000 |
1.0000 |
1.0000 |
0.7639 |
0.0090 |
0.0416 |
|
|
Vapor Phase Properties |
||||||||||||
|
Rate |
KG-MOL/HR |
n/a |
n/a |
6,000 |
5,692 |
1,495 |
n/a |
n/a |
n/a |
1,402 |
5,884 |
5,691 |
|
KG/HR |
n/a |
n/a |
105,391 |
188,165 |
31,083 |
n/a |
n/a |
n/a |
32,136 |
197,745 |
188,135 |
|
|
M3/HR |
n/a |
n/a |
2,836 |
37,317 |
9,254 |
n/a |
n/a |
n/a |
1,790 |
9,111 |
37,311 |
|
|
Molecular Weight |
n/a |
16.349 |
17.565 |
33.059 |
20.797 |
20.868 |
n/a |
17.122 |
22.920 |
33.606 |
33.059 |
|
|
Density |
KG/M3 |
n/a |
n/a |
37.162 |
5.042 |
3.359 |
n/a |
n/a |
n/a |
17.952 |
21.703 |
5.042 |
|
Thermal Conductivity |
KCAL/HR-M-C |
n/a |
n/a |
0.02205 |
0.01400 |
0.01426 |
n/a |
n/a |
n/a |
0.01793 |
0.01826 |
0.01400 |
|
Viscosity |
CP |
n/a |
n/a |
0.00923 |
0.00767 |
0.00699 |
n/a |
n/a |
n/a |
0.00844 |
0.00890 |
0.00767 |
|
Liquid Phase Properties |
||||||||||||
|
Rate |
KG-MOL/HR |
6,000 |
6,000 |
n/a |
247 |
4,444 |
5,939 |
5,938 |
5,938 |
4,536 |
54 |
247 |
|
KG/HR |
105,391 |
105,391 |
n/a |
12,078 |
169,160 |
200,243 |
200,209 |
200,209 |
168,073 |
2,464 |
12,075 |
|
|
K*M3/HR |
0.184 |
0.258 |
n/a |
0.021 |
0.289 |
0.284 |
0.283 |
0.308 |
0.319 |
0.005 |
0.021 |
|
|
Molecular Weight |
17.565 |
17.565 |
n/a |
48.862 |
38.061 |
33.717 |
33.717 |
33.717 |
37.054 |
45.860 |
48.862 |
|
|
Density |
KG/K*M3 |
572,565 |
408,517 |
n/a |
580,403 |
586,299 |
706,203 |
706,536 |
650,583 |
527,039 |
503,046 |
580,403 |
|
Surface Tension |
DYNE/CM |
12.0804 |
2.0127 |
n/a |
14.4014 |
17.5684 |
24.7862 |
24.7390 |
17.5157 |
10.2399 |
7.8816 |
14.4014 |
|
Thermal Conductivity |
KCAL/HR-M-C |
0.14057 |
0.08144 |
n/a |
0.10580 |
0.13047 |
0.16903 |
0.16882 |
0.13471 |
0.10258 |
0.08354 |
0.10580 |
|
Viscosity |
CP |
0.11227 |
0.03264 |
n/a |
0.18725 |
0.22701 |
0.60154 |
0.59679 |
0.23106 |
0.11291 |
0.10148 |
0.18725 |
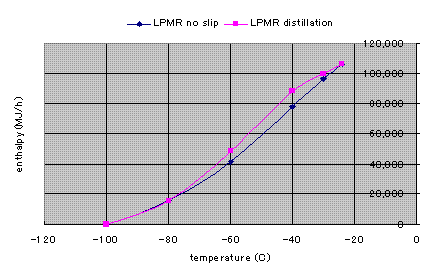
Composite cooling curve of no liquid reflux
Multi-stage flash model was build for LNG, HPMR and LPMR. The models are copy of the model made for natural gas liquefaction processes. Like liquefaction process, for making composite curve, you can not add up temperature. You can only add up enthalpy of the same temperature. Therefore, fixed temperature were specified for each flash drum and output duty were added to make composite curve. Each duty were plotted by Excel as follows.
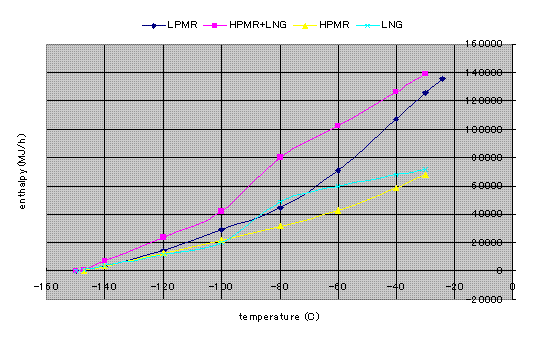
Composite cooling curve of no liquid reflux
Temperature difference between LPMR and HPMR+LNG composite curve looks like following graph.
Temperature difference were calculated by following equation.
Dti=DHi (ti-ti+1)/(Hi-Hi+1)LPMR
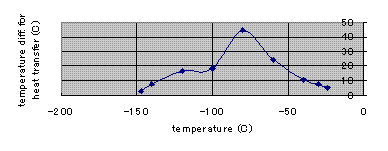
Temperature difference of no liquid reflux
Pinch point of upward evaporating LNG
When single core heat exchanger having fixed cross-sectional area is utilized, velocity change is proportional to outlet/mid point/inlet volume ratio. The expansion ratio at out let is 2,836/184=15.4. As outlet velocity is fixed by pressure drop, inlet velocity becomes very low. As LNG is a continuous flow, small quantity heavies fraction contained in LNG gradually accumulate by liquid slippage and raise evaporation temperature.
Pinch point by liquid reflux in upward condensing LPMR
As previously explained, commercial plant selected upward condensation of LPMR in warm core. Contraction ratio of LPMR of warm core is 9,543/37,338=0.26. When LPMR is cooled in upward channel liquid reflux start at the lowest temperature point. In the case of condensation, reflux of lighter fraction shift condensation temperature to lower side and temperature difference diminishes.
In making simulation, you have to specify the same pressure to which the flow is directed. Otherwise, simulation does not converge. This could be done by specifying pressure in splitter unit.
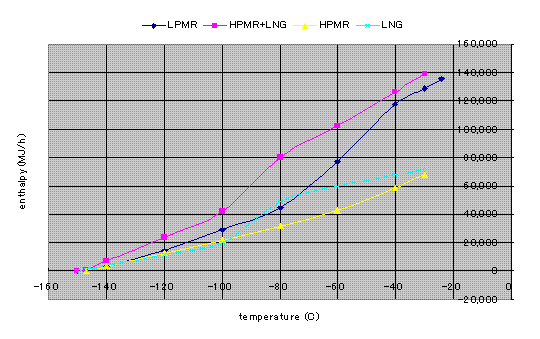
Composite cooling curve with liquid reflux
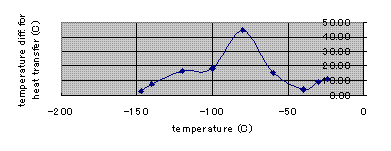
Temperature difference with liquid reflux
Shift of condensation temperature to lower side by liquid reflux
Temperature sink by liquid reflux reach -6oC as follows.
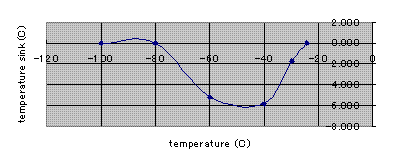
Temperature sink by liquid reflux
Temperature sink of 6oC around temperature of -50oC is attributable to the maximum reflux rate of about 30%. This means if maximum reflux rate is 50%, temperature sink of 10oC is expected.
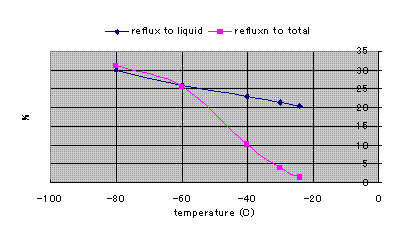
Reflux rate assumed
In this illustrative simulation, temperature difference in warm core is relatively large, pinch point was not found. But installed plant has better match of composite curve and encountered pinch point. Removing 2 out of 6 exchanger solved the problem.
Another factor is that overall contraction ratio of LPMR across warm and cold core is 284/37,338=0.0075. Different from LNG, LPMR is composed of fixed hold up of components. Combination of fixed hold up and extremely large contraction ratio means trapping heavy fraction in warm core. As a consequence, circulating MR becomes lighter. And condensing temperature of LPMR in downward condensing shifts to lower side.
Fluid mechanics of LPMR
Chapter 14 of Handbook of heat transfer by Warren M. Rohsenow, James P. Hartnett, Young I. Cho, McGraw-Hill Professional gives us a good criteria as to when such reflux start.
It is Wallis’ criteria of flooding. When preventing the down flow of liquid, sum of square root of dimensionless velocity become equal to C. When system is air-water, C=0.725.
(Vg*)1/2+ (Vl*)1/2=C=0.725
where dimensionless velocity;
Vg*=vgrg1/2/(gdi(rl-rg))1/2
Vl*=vlrl1/2/(gdi(rl-rg))1/2
Butterworth correction of C for other fluid.
C2=0.53(s/sw)0.5
s: surface tension, N/m
Using this criteria, one can estimate minimum turn down ratio and its velocity. The size of brazed aluminum heat exchanger used for the warm core is 1,600 x 1600 mm. Six of them were connected in parallel. Void (passage area/cross sectional area) is 0.667 and equivalent diameter of finned passage is 0.909mm.
|
Fluid |
Max. vol. Flow |
Vol. Share |
Heat Duty |
Duty share |
Cross sectional share |
|
m3/h |
% |
MMkcal/h |
% |
% |
|
|
LPMR |
37,338 |
88.3 |
32,336 |
49.3 |
75 |
|
HPMR |
2,109 |
5.0 |
16,208 |
24.7 |
12 |
|
LNG |
2,836 |
6.7 |
17,094 |
26.0 |
13 |
|
Total |
42,283 |
100.0 |
65,638 |
100.0 |
100 |
Considering volumetric share and duty share, designer of the exchanger might have allocated higher value of 75% for cross sectional share of LPMR.
For the purpose of meeting minimum demand of town gas, lowest capacity of 25% was mandatory requirements. But we found that we could not continue operation below 37%. Liquid start flowing back at -80oC point when upward flow velocity is 12cm/sec. In this case, LPMR inlet velocities are at 20.5cm/sec.
When we removed 2 exchangers out of 6, we could maintain velocity of 12cm/sec even at 25% of design.
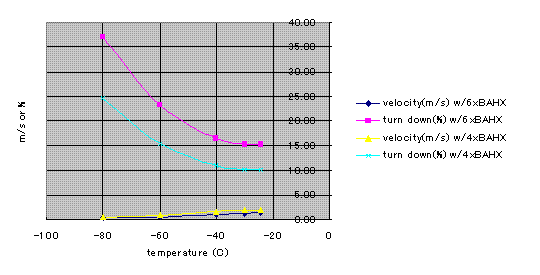
Minimum turn down ratio and LPMR velocity in warm core
Flow regime of 2 phase flow of LPMR
Flow patterns depend upon the ratio of shear forces to gravitational forces and ratio of liquid volume to vapor volume.
In the Chapter 14 of Handbook of heat transfer, there is a
chart showing dimensionless vapor volumetric flux, Jg*. vs.
Lockhart-Martinelli parameter for turbulent-turbulent flow Xtt
(Fig.-14.22).
Dimensionless vapor mass flux by Breber Jg*
Jg*=xGg/(grg(rl-rg)di)1/2
x: vapor quality which is 1 at the inlet, Gg: vapor
mass flux, kg/m2 s,
g: gravitational acceleration, 9.8m/s2, r:
density, kg/m3, di: fin equivalent diameter, m,
Lockhart-Martinelli parameter for turbulent-turbulent flow Xtt
Xtt=(ml/mg)(rg /rl) 1/2
m: mass flow, kg/s
Following is a flow regime when 6 exchangers are installed in parallel.
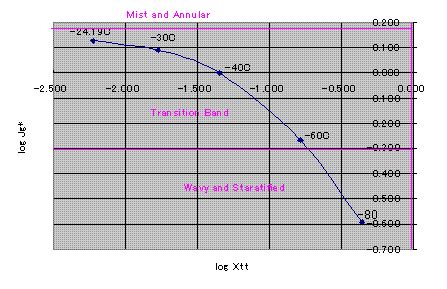
Flow regime of LPMR in warm core
Fluid mechanics of LNG
Until up to -100oC, LNG stays as liquid, therefore, vapor liquid separation does not occur in cold core. Hence, majority of 2 phase flow is in warm core. As it is down ward flow in warm core, no distillation effect was observed.
In pilot plant, LNG reached bubble point at the middle of the exchanger. At such low vapor flow region, liquid reflux caused distillation effect and heavies fraction accumulated in the exchanger. Same phenomena would be the cause of the poor performance of open rack vaporizer.
Fluid mechanics of HPMR
Bubble point is around -70oC, therefore, vapor liquid separation does not occur in cold core. Hence, majority of 2 phase flow is in warm core. Similar to LNG, it is down ward flow in warm core, and no distillation effect was observed.
In pilot plant, 2 phase region was smaller than LNG and heavy fraction was not supplied from outside the system, distillation effect was mild and allowed by-passing a part of HPMR to reduce excessive cold.
Conclusion
You must make it sure that the exchanger does not go into liquid reflux condition for any anticipated operational conditions. Especially care has to be taken when your turn down ratio is large and cool down speed is limited by mechanical reason.
Acknowledgment
Author is grateful to Invensys Systems Japan, Inc. for letting author to use PRO/II.
September 28, 2009
Rev. February 16, 2011